
Allworth Chief Investment Officer Andy Stout pulls back the curtain to give you insight into how we make portfolio and investment decisions.
While the coronavirus has forced tens of millions of Americans to adjust to a “new normal,” technology has enabled our Investment Department to seamlessly continue with our meetings and research.
Throughout the week, like many of you with your own careers, I’m engaged in near-constant video conferences and phone calls with my team. In these meetings, we’re analyzing the everchanging investment landscape and continuing to adapt and execute our multi-faceted and nuanced investment process.
In this month’s update, taking something of a break from the 800-pound gorilla in the room, we thought it would be interesting to go over our investment process so you can gain a deeper understanding of some of the things we do.
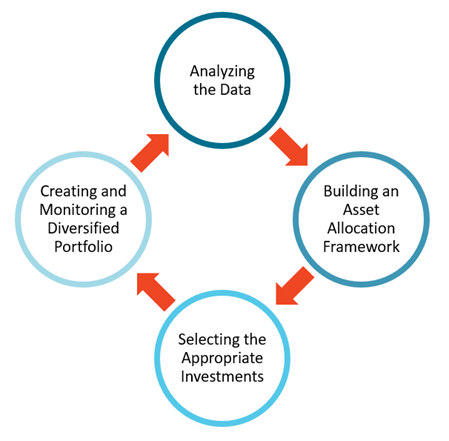
Analyzing the Data
We begin with a process by where we collect and study the economic data that we believe matters most. The data we look at can be separated into three overarching categories:
- Investment Data: Valuations, fundamental and technical statistics, volatility, and correlations
- Economic Data: Recession risk, financial conditions, economic growth, inflation, consumer spending, and so on
- Government Policy Data: Interest rates, balance sheet adjustments, other monetary stimulus, fiscal stimulus, tax, and trade
Of course, it's essential that there be a process in place to understand the data. Without a method, proper analysis would not be possible.
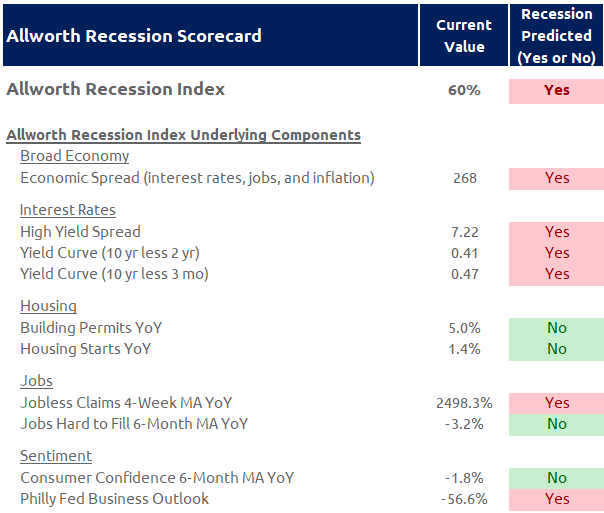
We take this data and transform it into usable forms in many ways. For just one example, we can gain an understanding of the economy’s recession risk through our weekly updated Allworth Recession Scorecard.

Another way we use this data is to rank various equity asset classes by multiple valuation metrics, including, but not limited to, price-to-earnings, price-to-cash flow, price-to-sales, price-to-book value, and the equity risk premium. We update and analyze this valuation data (at a minimum) on a monthly basis.
The below chart shows the current price-to-earnings, price-to-cash flow, price-to-sales, and price-to-book value as a percent of their 20-year average. (The lower the number, the more attractive the asset class.) For example, at the end of March 2020, valuations suggested that “value stocks” were relatively more attractive than “growth stocks.”
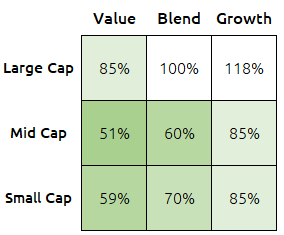
This of course is not meant to imply that value stocks will start to outperform growth stocks in the near term, but, when looking at these investments on a longer-term basis, it does suggest that value stocks might outperform growth stocks over a long duration.
We then take this valuation data, along with the other data we’ve collected, and use it to formulate our views on the many different stock and bond asset classes.
As we build out our asset allocation framework, we want to make sure that the investment mix is complementary. We do this by taking into consideration correlations of various asset classes. Ideally, a diversified portfolio would be made up of asset classes with low correlations. This means that the asset classes in your portfolio would not all be moving together when markets go up or go down. What you want is when an asset class is declining, there is something else in your portfolio doing well that mitigates the move lower.
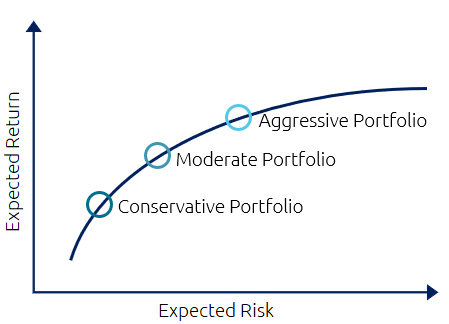
The math behind this is known as portfolio optimization, and the end goal is to create a group of asset classes (or a portfolio) that maximizes expected return for a given level of risk. Naturally, the less risk in a portfolio, the lower the expected return, and vice versa.
Once we have built an efficient allocation, we will stress test it to see how it performed in different scenarios. For example, we will evaluate to determine how a similar 60/40 stock-to-bond allocation would have performed in various historical situations, such as the broad stock market rising and falling 20%, the economy dipping into a global recession, interest rates rising, and so on.
Should the designed asset mix not test well in our scenario analysis, we will revisit the optimization process.
Selecting the Appropriate Investments
After we’ve determined the weights for various asset classes, we’ll select investment securities to fill the asset class buckets. We begin this process by scoring (rating) more than 15,000 different mutual funds and exchange-traded funds (ETFs) each month.
When we score a fund, we look at more than 50 different data points, including the fund manager’s tenure, up/down capture ratios, Sharpe ratios, standard deviations, performance compared to their peers, and much more.
If a fund scores well, we’ll follow up with the portfolio managers to determine if we believe they have a repeatable process that will produce long-term outperformance. After additional meetings and discussions, we might add the fund to our investment lineup, or perhaps include it in our backup manager list.
Creating and Monitoring a Diversified Portfolio
To be clear, the right mix of stocks and bonds for you is based on your financial plan. While your plan will help determine how much risk you need to take to meet your financial goals, it’s also necessary to figure out how much risk you are willing to take. (This is something your financial advisor goes over with you in detail.)
The bottom line is, if you have the right investment mix, you should still be able to sleep at night even when there is market turbulence.
Once we’ve put together an investment mix for you – by understanding your personal situation and following our investment process – we continue to regularly monitor your portfolio.
As part of that ongoing monitoring process, we review the asset classes and funds in your portfolio. The funds in your portfolio and those on our backup manager list go through a detailed review at least on a monthly basis.
Lastly, we rebalance your portfolio as part of our ongoing and disciplined process. If your portfolio drifts too far from the target stock/bond allocation (say, a particular asset class within your portfolio overperforms and your allocation strays too far from what’s been determined to be ideal for your personal situation), we will commence with a rebalance back to target.
This is in effect a “buy low, sell high” strategy.
That’s it for the April edition of Allworth’s Market Update.
Rest assured, even though we are currently (mostly) working from home, and even though this is an unusual time in our history, we are still managing investments using the same disciplined process we have always utilized.
And, the fact is, we’re going to continue to do that no matter how outside forces impact our lives.
All data from Bloomberg. The Allworth Recession Index is made up of leading economic indicators, which are data points that have historically moved before the economy. The index value is calculated as a percent of the indicators that are sending signals that suggests recession risk is elevated. When the index value is greater than 40%, we believe there is a greater chance for a recession in the next six to nine months. All data begins by 1971 unless noted below. The indicators that make up the Allworth Recession Index are the 3-Month Government Bond Yield, 2-Year Government Bond Yield (beginning in 1976), 10-year Government Bond Yield, BarCap US Corp HY YTW – 10 Year Spread (beginning in 1987), Conference Board Consumer Confidence, Consumer Price Index, NFIB Small Business Job Openings Hard to Fill (beginning in 1976), Private Housing Authorized by Building Permits by Type, US Federal Funds Effective Rate, US Initial Jobless Claims, US New Privately Owned Housing Units Started by Structure, and US Unemployment Rates.
Past performance does not guarantee future results. Any stock market transaction can result in either profit or loss. Additionally, the commentary should also be viewed in the context of the broad market and general economic conditions prevailing during the periods covered by the provided information. Market and economic conditions could change in the future, producing materially different returns. Investment strategies may be subject to various types of risk of loss including, but not limited to, market risk, credit risk, interest rate risk, inflation risk, currency risk and political risk.
This commentary has been prepared solely for informational purposes, and is not an offer to buy or sell, or a solicitation of an offer to buy or sell, any security or instrument or to participate in any particular trading strategy or an offer of investment advisory services. Investment advisory and management services are offered only pursuant to a written Investment Advisory Agreement, which investors are urged to read and consider carefully in determining whether such agreement is suitable for their individual needs and circumstances.
Allworth Financial and its affiliates and its employees may have positions in and may affect transactions in securities and instruments mentioned in these profiles and reports. Some of the investments discussed or recommended may be unsuitable for certain investors depending on their specific investment objectives and financial position.
Allworth Financial is an SEC-registered investment advisor that provides advisory services for discretionary individually managed accounts. To request a copy of Allworth Financial’s current Form ADV Part 2, please call our Compliance department at 916-482-2196 or via email at compliance@allworthfinancial.com.
April 17, 2020
 January 12, 2024
Fourth Quarter 2023 Market Update
January 12, 2024
Fourth Quarter 2023 Market Update
Allworth's Co-CEO Scott Hanson and Chief Investment Officer Andy Stout team up for this fourth quarter 2023 market update video.
Read Now December 15, 2023
December 2023 Market Update
December 15, 2023
December 2023 Market Update
Chief Investment Officer Andy Stout takes a look back on the year to help give perspective to what's on the horizon in 2024. At the beginning of this …
Read Now November 17, 2023
November 2023 Market Update
November 17, 2023
November 2023 Market Update
Chief Investment Officer Andy Stout examines whether there’s a chance the US dollar will lose its status as the world’s reserve currency. There is a …
Read Now