
Allworth Chief Investment Officer Andy Stout discusses some of the drivers of the latest stock market rally and whether it can continue.
If you’ve played a fair amount of sports, you’ve hopefully experienced the incredible feeling of being in a groove. That sensation you get when all your hard work seems to pay off, and everything goes just right. (Maybe you hit every drive straight down the fairway, or each of your tennis serves hits just inside the line.)
As the current stock market rally hasn’t faced much of an interruption, that sense of momentum is how many investors feel right now.
Last year was a historic one for the markets, but if you blinked with the arrival of COVID, you might have missed this: From its peak on February 19th, 2020, we saw history’s quickest ever fall (from a record high) into a bear market, only to be followed by an almost-as-fast reversal as prices bottomed on March 23rd... and then immediately began to move higher.
Given the uncertainties that we’ve faced, many people are curious as to why the market has continued to perform so well.
Why has the stock market continued to climb in the face of a global pandemic?
There are numerous reasons for the run-up in equities. The table below lists some of the main drivers and where we currently stand with each.
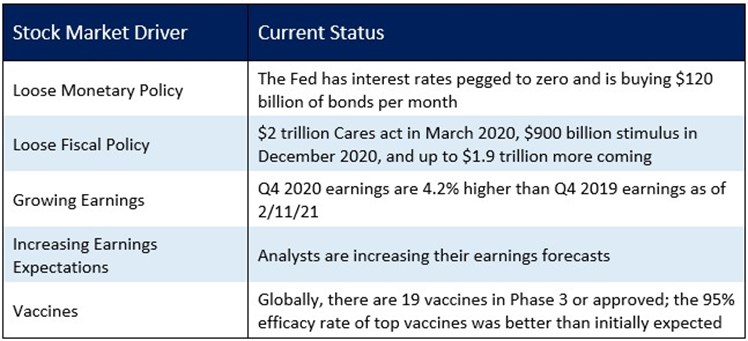
The first two drivers above have to do with the government’s response to the crisis. The reaction function of cutting rates to zero and spending money typically helps the economy recover from a slowdown.
Interestingly, this recovery has been characterized as “K” shaped. This represents a tale of two economies. The portion of the “K” that is trending up represents those people that didn’t lose their job, have enjoyed the rise in the stock market, and have seen the value of their home increase. The down portion of the “K” represents those people who have lost their job and do not have an opportunity to get a new one, most likely because their work sector has been shut down.
So, while the fiscal stimulus might seem unnecessary to some people, it should help keep struggling Americans afloat until the economy reopens more widely (thanks to effective vaccines). Looking ahead to when that happens, the nearly 14% personal savings rate should combine with pent-up consumer demand to create a robust recovery. The reopening could also mean that those who’ve been unable to work are again able to find jobs, and that too should result in more spending.
Over the long run, earnings have been one of the most important drivers of stock prices. Earnings have come in better than expected, growing more than 4% over the past year, which is obviously much better than the near 9% decline Wall Street analysts were forecasting.
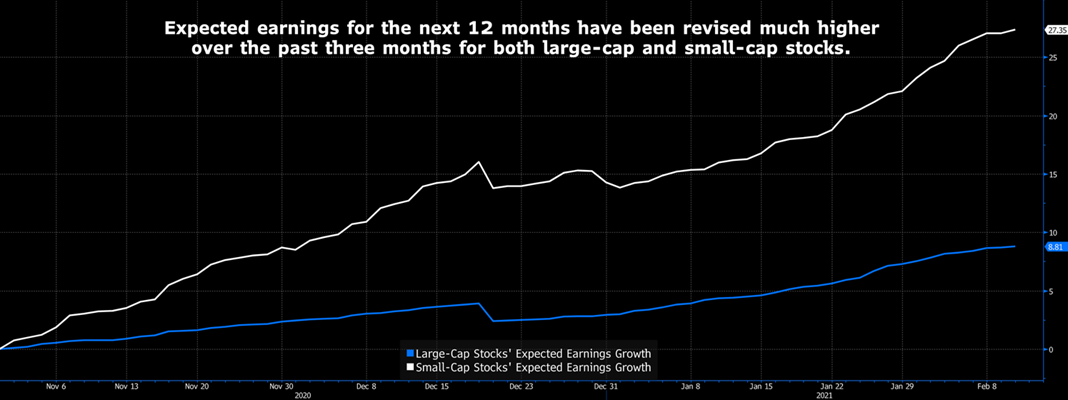
All that, and not only are corporate profits from last quarter beating expectations, but expected future profits are also being revised higher. The chart below shows that 12-month forward earnings have been revised higher by 9% for large-cap stocks and by a whiplash-inducing 27% for small-cap stocks. (Remember, none of this is guaranteed to happen.)
One reason that profits have been improving (and are expected to keep getting better) is higher sales combined with lower expenses. The year-over-year change in sales for large-cap stocks in the fourth quarter of 2020 is 2.1% higher. Further, compared to 2020, sales are expected to rise about 10% in 2021.
With companies expected to reduce expenses (by renting less office space, for one), Wall Street is forecasting earnings to jump 23% this year. Part of the reason for this is that many companies underwent massive restructuring during the crisis and are now prepared to operate more efficiently even as demand picks up.
Is the stock market running out of steam?
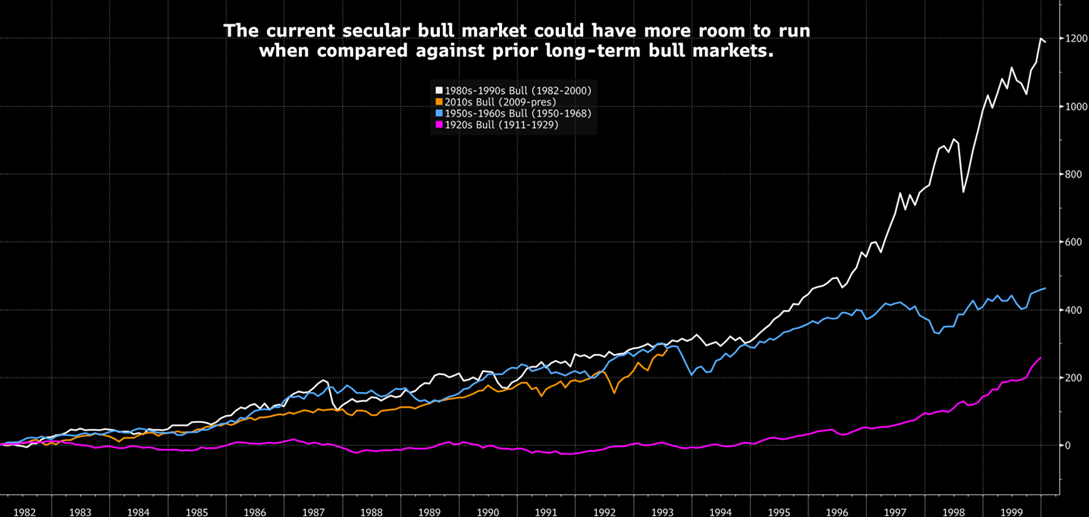
Absolutely no one can say with any certainty what lies ahead for stocks, but the comparisons to other long-term bull markets shows that when we look at the market since 2009, there could be more room to run.
Historically, there have been a handful of secular bull markets, with each averaging around 18 years in duration. As far as the total return goes, the move since 2009 has been in line with other major secular bull markets. This suggests that comparisons to the Tech Bubble or the Great Depression might not be appropriate.
Now, to be sure, this doesn’t mean stocks won’t suffer pullbacks. Elevated market valuations (e.g. high price-to-earnings ratios) and excessive optimism have created an environment where the market could experience a decline. Valuations and sentiment are not typically catalysts for short-term movements, but they can exaggerate volatility. The fact is that there could be any number of other catalysts, including an inflation scare, geopolitical tensions, and virus setbacks, just to name a few.
Remember, over the past three calendar years, there have been violent drawdowns of 20%, 7%, and 34%. You should never be surprised by volatility, which could again occur at any time. What some people attempt to do is to sidestep the market when there is a bout of this volatility, but our experience shows that, time and again, “timing” the market often backfires.
Case in point: Over the past 25 years, if you tried to time the market by jumping out and you missed the 10 best days, an investment of $100,000 in large-cap stocks would have grown to about $450,000. However, if you stayed the course and didn’t miss those 10 best days, that $100,000 investment would have ballooned to almost $980,000.
At Allworth Financial, we don’t “time” markets, we view them dispassionately. We follow a consistent, disciplined approach and investment process that helps our clients navigate these catalysts and thrive in uncertain environments. We believe that without an unemotional process that supports your personalized financial plan, you place yourself at greater risk of falling short of your retirement goals.
All data unless otherwise noted is from Bloomberg. Past performance does not guarantee future results. Any stock market transaction can result in either profit or loss. Additionally, the commentary should also be viewed in the context of the broad market and general economic conditions prevailing during the periods covered by the provided information. Market and economic conditions could change in the future, producing materially different returns. Investment strategies may be subject to various types of risk of loss including, but not limited to, market risk, credit risk, interest rate risk, inflation risk, currency risk and political risk.
This commentary has been prepared solely for informational purposes, and is not an offer to buy or sell, or a solicitation of an offer to buy or sell, any security or instrument or to participate in any particular trading strategy or an offer of investment advisory services. Investment advisory and management services are offered only pursuant to a written Investment Advisory Agreement, which investors are urged to read and consider carefully in determining whether such agreement is suitable for their individual needs and circumstances.
Allworth Financial and its affiliates and its employees may have positions in and may affect transactions in securities and instruments mentioned in these profiles and reports. Some of the investments discussed or recommended may be unsuitable for certain investors depending on their specific investment objectives and financial position.
Allworth Financial is an SEC-registered investment advisor that provides advisory services for discretionary individually managed accounts. To request a copy of Allworth Financial’s current Form ADV Part 2, please call our Compliance department at 916-482-2196 or via email at compliance@allworthfinancial.com.
February 12, 2021
 January 12, 2024
Fourth Quarter 2023 Market Update
January 12, 2024
Fourth Quarter 2023 Market Update
Allworth's Co-CEO Scott Hanson and Chief Investment Officer Andy Stout team up for this fourth quarter 2023 market update video.
Read Now December 15, 2023
December 2023 Market Update
December 15, 2023
December 2023 Market Update
Chief Investment Officer Andy Stout takes a look back on the year to help give perspective to what's on the horizon in 2024. At the beginning of this …
Read Now November 17, 2023
November 2023 Market Update
November 17, 2023
November 2023 Market Update
Chief Investment Officer Andy Stout examines whether there’s a chance the US dollar will lose its status as the world’s reserve currency. There is a …
Read Now