
You're About to Witness History Being Made
We’re on the verge of something we’ve never seen before: If the U.S. economy keeps growing until July, our current economic expansion (it began in June 2009) will be the longest ever!
In the post-World War II era, there have been 11 other economic expansions.
Those 11 have averaged almost five years in duration, which is much shorter than our current 10-year expansion. (It should be noted that the past few expansions have also been longer than average, though.)
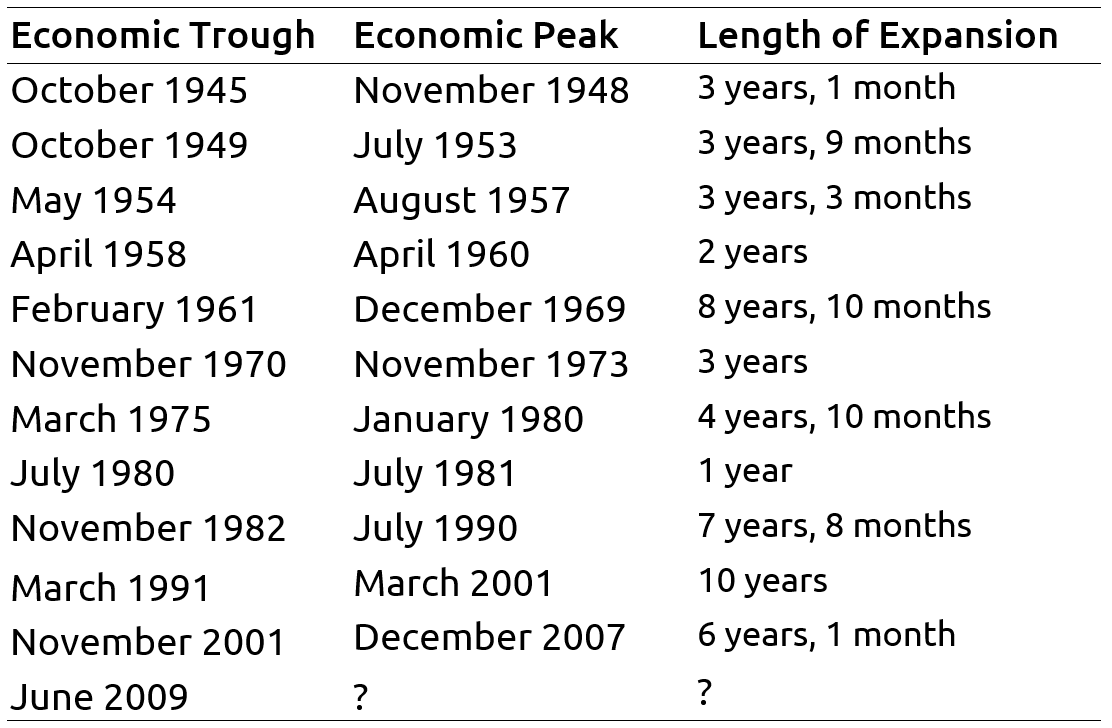
Of course, this begs the question, “Are we due for a recession?”
Even though the current expansion has lasted a long time, merely using a calendar to predict we’re overdue for a decline doesn’t take into consideration just how the economy works.
Instead of looking to a calendar, we prefer to study key data points.
It’s commonly thought that a recession is two consecutive quarters of negative economic growth.
But that is wrong. For instance, the 2001 recession never experienced two straight quarters of negative economic growth.
The National Bureau of Economic Research (NBER) is the government entity tasked with officially determining when a recession occurs.
While broad economic growth, also known as gross domestic product (or GDP), is analyzed (along with many other indicators), the NBER explicitly states that it looks at employment, income, industrial production (a measure of manufacturing), and retail sales when determining the dates of a recession.
Over the course of our current expansion, there have been a few periods where the economy struggled, such as in 2015 when industrial production, income, and retail sales stalled. However, even then, the job market continued to grow, helping the economy to keep growing.
Current data shows the four main indicators the NBER looks at (employment, income, industrial production, and retail sales) are still broadly trending higher.
There is some weakness in the volatile industrial production data. There are many reasons for this. One likely cause is that companies stockpiled goods to get out ahead of the trade war and the tariffs that came along with it.
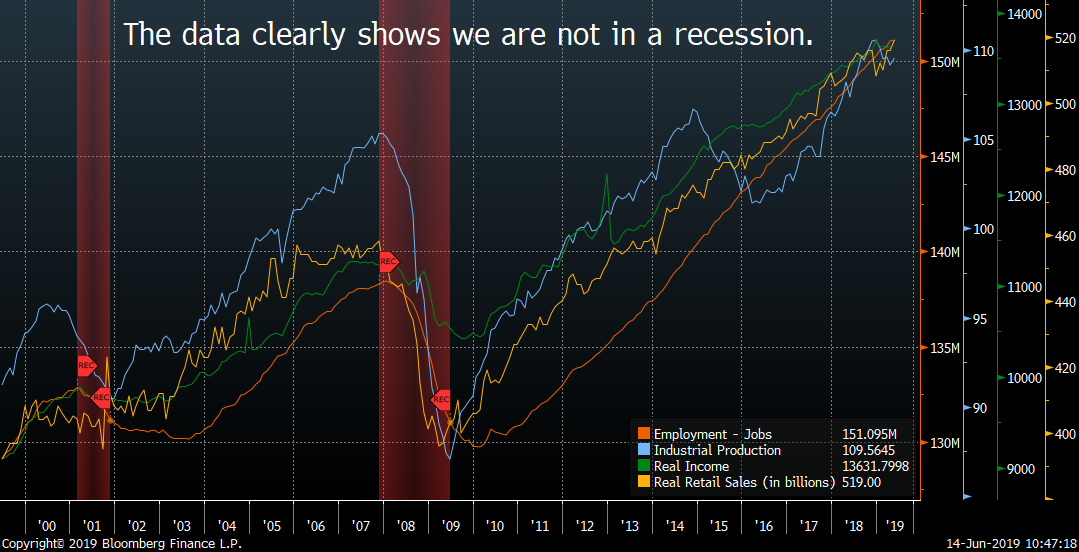
As a result, companies have a large inventory of goods and additional production is not needed at this time.
These four indicators are considered “coincident indicators,” meaning they move at the same time as the economy. Leading economic indicators are more important when we look forward because they are data points that move before the broad economy moves.
We’ve created an index that combines many individual leading economic indicators.
We call this combination the Allworth Recession Index.
Measuring past recessions, a signal is generated when the index moves above 40. Looking at the past six recessions, this index would have warned, on average, of a slowdown about eight months prior to its onset.
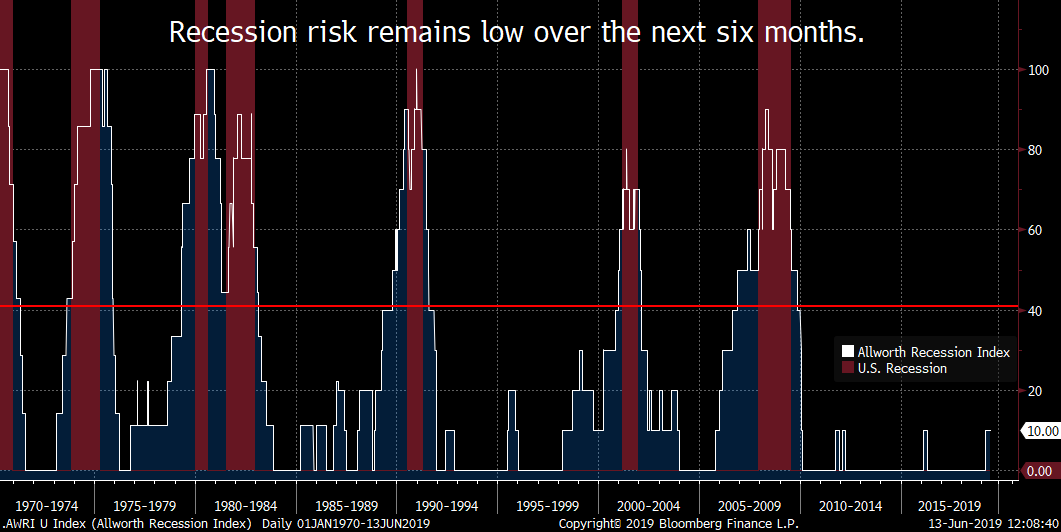
Today, the Allworth Recession Index is at 10, suggesting there is a low risk of recession (through the remainder of 2019, at least).
Prior to the Great Recession, many leading indicators we followed were signaling for a slowdown. But, currently, only one of our main leading indicators points to a recession. The indicator that is sending a red flag is the difference between long-term interest rates and short-term interest rates. Specifically, it’s the 10-year treasury bond rate and the 3-month treasury bond rate that show elevated risk.
This part of the yield curve has inverted, meaning short-term rates are greater than long-term rates. These interest rates can be thought of as your reward for taking risk, so when you’re rewarded more for investing in a 3-month bond than a 10-year bond, there is more risk in the near term and a higher chance of an economic downturn.
When yield curve inversions have occurred in the past, recessions usually followed. However, the time to the next recession following an inversion was usually at least a year off. The last time this part of the yield curve inverted, a recession didn’t occur until 22 months later.
Of course, this indicator is not perfect (no indicator is). It falsely predicted recessions in 1966 and 1998.
What followed both those inversions was the Federal Reserve (Fed), our nation’s central bank, cutting overnight interest rates to engineer a soft economic landing. At this point, the market is pricing in about two to three interest rate cuts in 2019 (this is calculated using Fed Funds futures contracts), so perhaps the Fed can orchestrate another soft landing.
To be clear, we take the yield curve inversion seriously. However, we prefer to look at a suite of indicators instead of just one. That is why we pay close attention to not just the Allworth Recession Index but also to many other economic data points.
We believe that this current expansion will indeed enter the record books as the longest in history (but that does not mean that a recession is imminent).
We will never use the calendar to justify an economic view, but instead, use data.
And, as of today, data suggests a low risk of recession.
Source: Table data comes from the National Bureau of Economic Research (NBER). Charts and data referenced from Bloomberg.
Past performance does not guarantee future results. Any stock market transaction can result in either profit or loss. Additionally, the commentary should also be viewed in the context of the broad market and general economic conditions prevailing during the periods covered by the provided information. Market and economic conditions could change in the future, producing materially different returns. Investment strategies may be subject to various types of risk of loss including, but not limited to, market risk, credit risk, interest rate risk, inflation risk, currency risk and political risk.
This commentary has been prepared solely for informational purposes, and is not an offer to buy or sell, or a solicitation of an offer to buy or sell, any security or instrument or to participate in any particular trading strategy or an offer of investment advisory services. Investment advisory and management services are offered only pursuant to a written Investment Advisory Agreement, which investors are urged to read and consider carefully in determining whether such agreement is suitable for their individual needs and circumstances.
The Allworth Recession Index is made up of leading economic indicators, which are data points that have historically moved before the economy. The index value is calculated as a percent of the indicators that are sending signals that suggests recession risk is elevated. When the index value is greater than 40%, we believe there is a greater chance for a recession in the next six to nine months. All data begins by 1971 unless noted below. The indicators that make up the Allworth Recession Index are the 3-Month Government Bond Yield, 2-Year Government Bond Yield (beginning in 1976), 10-year Government Bond Yield, BarCap US Corp HY YTW – 10 Year Spread (beginning in 1987), Conference Board Consumer Confidence, NFIB Small Business Job Openings Hard to Fill (beginning in 1976), Private Housing Authorized by Building Permits by Type, US Federal Funds Effective Rate, US Initial Jobless Claims, US New Privately Owned Housing Units Started by Structure, and US Unemployment Rates.
Allworth Financial and its affiliates and its employees may have positions in and may effect transactions in securities and instruments mentioned in these profiles and reports. Some of the investments discussed or recommended may be unsuitable for certain investors depending on their specific investment objectives and financial position.
Allworth Financial is an SEC-registered investment advisor that provides advisory services for discretionary individually managed accounts. To request a copy of Allworth Financial’s current Form ADV Part 2, please call our Compliance department at 916-482-2196 or via email at compliance@allworthfinancial.com.
June 21, 2019
 January 12, 2024
Fourth Quarter 2023 Market Update
January 12, 2024
Fourth Quarter 2023 Market Update
Allworth's Co-CEO Scott Hanson and Chief Investment Officer Andy Stout team up for this fourth quarter 2023 market update video.
Read Now December 15, 2023
December 2023 Market Update
December 15, 2023
December 2023 Market Update
Chief Investment Officer Andy Stout takes a look back on the year to help give perspective to what's on the horizon in 2024. At the beginning of this …
Read Now November 17, 2023
November 2023 Market Update
November 17, 2023
November 2023 Market Update
Chief Investment Officer Andy Stout examines whether there’s a chance the US dollar will lose its status as the world’s reserve currency. There is a …
Read Now