
Allworth Chief Investment Officer Andy Stout explores the rising risk of inflation and what that means for you.
I’ve never been one for cliffhangers, so let’s get right to the point: It’s likely elevated inflation is here to stay until at least the middle of next year.
And with that out of the way, let’s dive right into what has changed over the past few months, what that could mean for the economy, and what that might mean for the markets.
What’s changed?
1. The Supply Chain
A primary driver of the supply chain problems that gets little-to-no attention is that consumer spending behaviors have changed. Since 2002, when the data series began, consumers, on average, spent 34% of their total spending on goods. Then the pandemic hit, and since March 2020, that has soared to 40%.
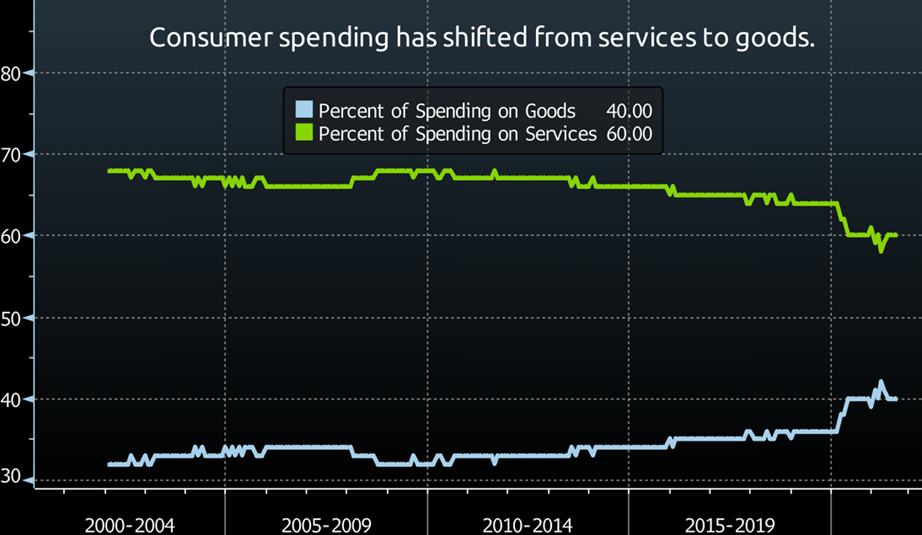
While this might appear insignificant, it’s far from it, as we’re talking about billions of redirected dollars. More specifically, the annualized spending on goods in February 2020 was about $1.8 trillion. That spending has now risen to $2.1 trillion.
In other words, this shift has contributed an additional $300 billion in spending on goods. This influx of goods is a big part of the port backlog because the shift happened almost immediately, which didn’t allow time for any logistical updates.
More than 60 ships are sitting off the coast of Southern California, holding about 200,000 large shipping containers. While the backlog has improved from about a week ago, when roughly 100 ships were waiting to unload, we are still nowhere near a typical operating environment.
Part of the reason for this improvement is that the ports are now operating 24/7. However, a shortage of truck drivers means those ports can’t get the goods on the road as quickly as possible.
The shift in spending patterns and other supply chain problems mean that demand is up and supply is down. Classic economics tells us this is a recipe for higher prices.
Of course, other factors affect the supply chain, such as a lack of raw materials and factories not operating close to standard capacity due to various COVID-19 issues. Unfortunately, a recent survey of economists showed that most don’t expect the supply chain disruptions to get much better until at least the second quarter of 2022.
2. Inflation Sources
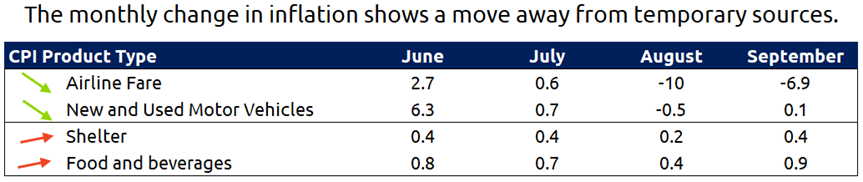
Looking back just a few months to June, consumer inflation (CPI) sources have moved from primarily temporary to slightly more permanent. Transitory sources comprised about 66% of the increase in the month-over-month change in the June CPI report. But now, about 80% of the change in CPI is due to basic necessities.
For example, this table shows that the temporary inflation sources from a few months ago have declined, while other sources have remained elevated. To be fair, food and beverage inflation is highly volatile, but consumers are undoubtedly feeling the pinch. Even though the increase in shelter prices (housing and rent) appears minimal compared to the other sources below, it’s not, as shelter accounts for about a third of total CPI.
3. There Are Myriad Other Reasons
We’ve covered two of the more significant issues, but plenty of other drivers are behind the change in inflation expectations over the past few months:
Energy: Rising gasoline and electrical costs are two areas where consumers are burdened by inflation. Gasoline prices are directly related to oil, which has soared more than 60% this year to over $80 per barrel. Part of the reason for this is that oil producers aren’t generating as much oil as possible. OPEC+ (Organization of the Petroleum Exporting Countries plus Russia) has not increased oil production to the level many analysts hoped. Also, President Biden asked US oil producers to increase output, but they’re reluctant to because of the adverse regulatory environment.
Electrical costs affect consumers because fossil fuels are responsible for 60% of electricity generated in the US (~40% from natural gas + ~20% from coal). On a year-to-date basis, coal prices are about 180% higher, while natural gas has roughly doubled.
Labor Shortage: There are 10.4 million job openings in the US, significantly more than the 7.7 million unemployed people. The phenomenon of more job openings than unemployed is relatively new, occurring for the first time in 2018. However, the current gap is the largest ever. Even with the federal government ending the extra $300 in weekly unemployment benefits, there hasn’t been a surge of workers into the labor force.
This gap is causing employers to pay more for labor than they want. For example, McDonald’s and Chipotle upped their average hourly wage to $15 per hour. Some employers are limiting their hours of operation if they can’t find workers. (For example, this week I received an email from my vet explaining why they were temporarily reducing their hours.)
Stimulus: At the onset of the pandemic, the government flooded money into the economy to keep it afloat. It now seems probable that Congress will soon pass a stimulus package of about $2 trillion, resulting in increased spending. Unfortunately, this spending has the potential to push prices even higher.
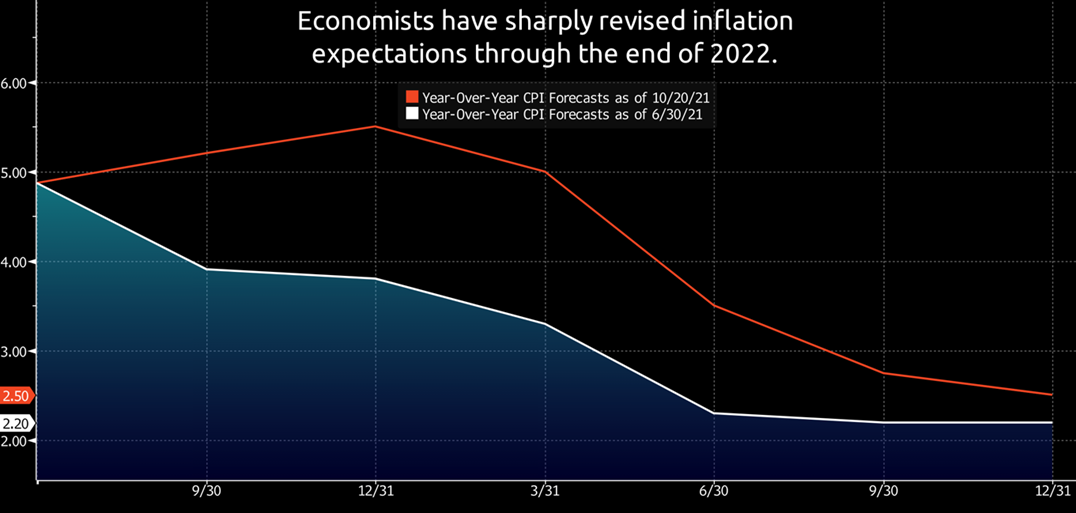
How have inflation expectations changed?
Many economists expected inflationary pressures to ease near the end of this year. However, those views have shifted because of the reasons discussed above.
It’s not just economists that have updated their outlook. The bond market also has. This new view can be observed by analyzing inflation breakevens. Simply put, inflation breakevens are what the bond market expects CPI to average over various periods.
These breakevens are pricing a CPI reading of 4.02% over the next 12 months and 3.13% over the next 24 months. We can deconstruct this to see that CPI is expected to be 2.2% for months 13 through 24.
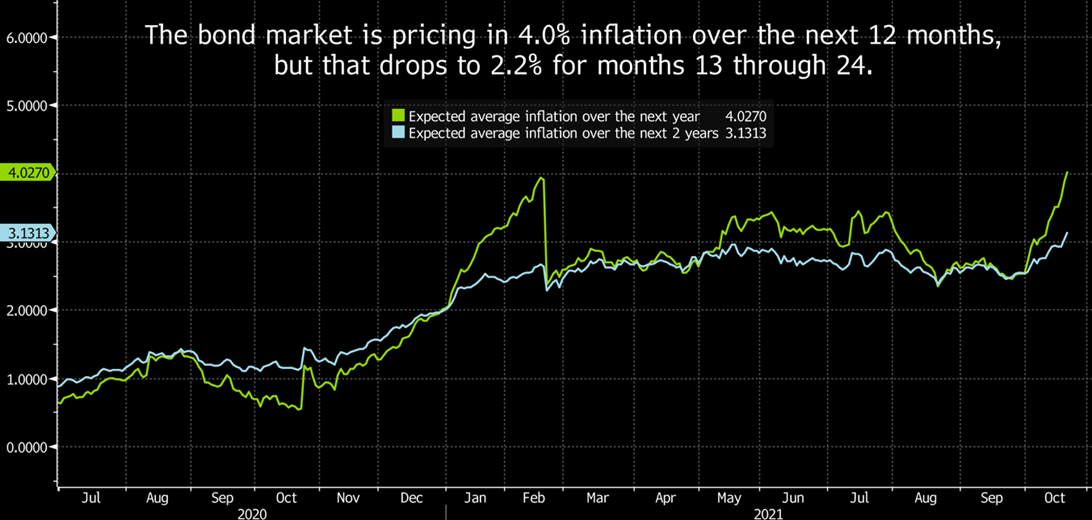
This analysis tells us that, based on today’s data, inflation should moderate around the middle part of 2022.
What might the Federal Reserve do given this inflationary backdrop?
Our nation’s central bank, the Federal Reserve (Fed), has a dual mandate of stable inflation and full employment. The Fed’s September meeting minutes showed that many participants were concerned about rent increases due to higher house prices. As noted above, this is important because shelter makes up about a third of total CPI.
With that in mind, the Fed is on track to taper its quantitative easing program. Near the beginning of the pandemic, the Fed began buying $120 billion of bonds every month to help keep long-term rates low and encourage economic growth. But with millions of people finding work and inflationary pressures bubbling to the surface, the Fed has indicated it will begin to reduce these purchases, possibly wrapping up by the middle part of next year.
Another way the Fed attempts to achieve its dual mandate is by controlling overnight interest rates. The Fed immediately cut rates to zero in March 2020.
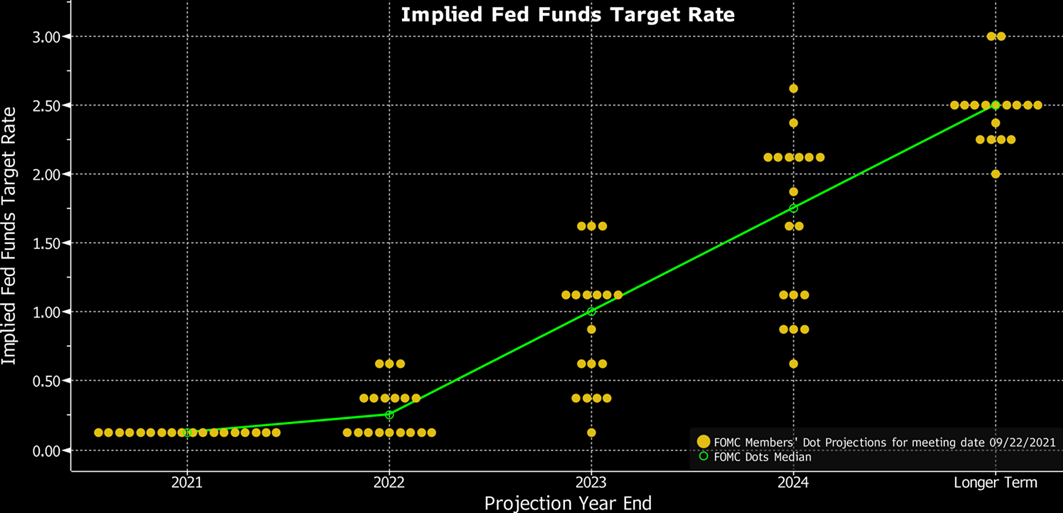
Every quarter, the Fed provides its infamous dot plot to help us gauge its intentions when it comes to future rate hikes. The dot plot shows where each Fed member thinks the fed funds rate should be at the end of the upcoming calendar years. Because it’s unknown whose dot belongs to whom, the median dot is what many market participants focus on to gauge the Fed’s potential plans. For example, the update in June suggested no hikes in 2022 and two by the end of 2023. However, the September dot plot shows one hike next year and a total of three by the end of 2023.
We can observe the pace of rate hikes the market expects by studying fed fund futures. These instruments imply there is a 74% chance of two rate hikes by the end of 2022. Further, there is about a 90% chance of four rate hikes by the end of 2023 (this includes 2022).
How might inflation impact the markets?
A nuanced understanding of economic reaction functions is necessary because markets will be influenced by more than just inflation. Investment textbooks state that interest rates could rise and value stocks could outperform growth stocks in an inflationary environment.
However, the key is not just knowing where inflation is today, but it’s about having a view and understanding if that’s different from what the market is expecting. If one believes what’s already priced in (see inflation breakevens above), then there’s no reason to tilt your investment mix in any direction. But, if you believe inflation might be hotter or colder than expected, then changes to your portfolio should be considered.
October 22, 2021
All data unless otherwise noted is from Bloomberg. Past performance does not guarantee future results. Any stock market transaction can result in either profit or loss. Additionally, the commentary should also be viewed in the context of the broad market and general economic conditions prevailing during the periods covered by the provided information. Market and economic conditions could change in the future, producing materially different returns. Investment strategies may be subject to various types of risk of loss including, but not limited to, market risk, credit risk, interest rate risk, inflation risk, currency risk and political risk.
This commentary has been prepared solely for informational purposes, and is not an offer to buy or sell, or a solicitation of an offer to buy or sell, any security or instrument or to participate in any particular trading strategy or an offer of investment advisory services. Investment advisory and management services are offered only pursuant to a written Investment Advisory Agreement, which investors are urged to read and consider carefully in determining whether such agreement is suitable for their individual needs and circumstances.
Allworth Financial and its affiliates and its employees may have positions in and may affect transactions in securities and instruments mentioned in these profiles and reports. Some of the investments discussed or recommended may be unsuitable for certain investors depending on their specific investment objectives and financial position.
Allworth Financial is an SEC-registered investment advisor that provides advisory services for discretionary individually managed accounts. To request a copy of Allworth Financial’s current Form ADV Part 2, please call our Compliance department at 916-482-2196 or via email at compliance@allworthfinancial.com.
 January 12, 2024
Fourth Quarter 2023 Market Update
January 12, 2024
Fourth Quarter 2023 Market Update
Allworth's Co-CEO Scott Hanson and Chief Investment Officer Andy Stout team up for this fourth quarter 2023 market update video.
Read Now December 15, 2023
December 2023 Market Update
December 15, 2023
December 2023 Market Update
Chief Investment Officer Andy Stout takes a look back on the year to help give perspective to what's on the horizon in 2024. At the beginning of this …
Read Now November 17, 2023
November 2023 Market Update
November 17, 2023
November 2023 Market Update
Chief Investment Officer Andy Stout examines whether there’s a chance the US dollar will lose its status as the world’s reserve currency. There is a …
Read Now