Allworth Chief Investment Officer Andy Stout looks at the economic reopening and the proposed infrastructure bill to see how the economy might evolve throughout the year.
The start of spring is one of my favorite times of the year, with winter in the rearview mirror and baseball’s Opening Day providing optimism for fans of every MLB team. It seems only fitting that with spring just underway the economic reopening is also ramping up.
Medical progress is fueling economic optimism (in the U.S.)
The economy is showing signs of life because more people feel comfortable going out in public after they’ve been vaccinated. With three approved for use in the U.S., the vaccines are becoming more available. This has resulted in about 34% of the population receiving at least one dose, and approximately 20% having already been fully vaccinated.
As the vaccine campaign in the U.S. charges ahead, in many areas, local governments are relaxing economic restrictions, allowing businesses to more fully open.
Unfortunately, the same isn’t true outside of the U.S. In the European Union (EU), which doesn’t include the United Kingdom, roughly just 14% of the population has received at least one dose.
This disastrous vaccine rollout is part of the reason that daily new cases are close to record levels overseas. This has caused strict lockdowns to remain in force in most of the EU. In France, for example, all schools are going to remote learning and all non-essential shops are closed. Other tight restrictions are in place across most of the continent.
Economic 'green shoots' abound
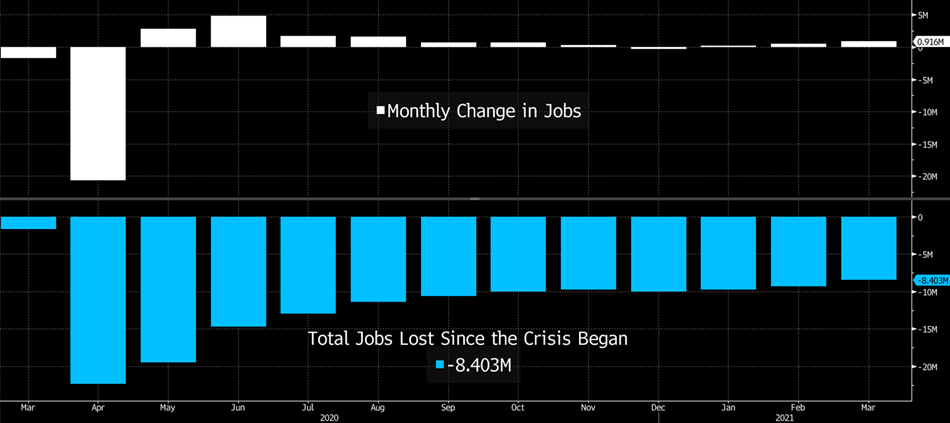
In March and April of last year, a staggering 22 million jobs were lost in the U.S. when the economy completely shut down. A partial reopening led to some quick gains during the summer months, but by the end of the year, we were still 10 million jobs shy of where we were before the crisis.
However, over the past three months, economic momentum has picked up. With 233,000 in January, 468,000 in February, and 916,000 in March, the jobs report has shown an increase each month in the number of new hires.
(The top panel of the following graph shows monthly job changes, and the bottom panel shows the total job change since March 2020.)

While this still leaves us 8.4 million jobs short of where we were, the job gains should continue in the months ahead with millions added this year.
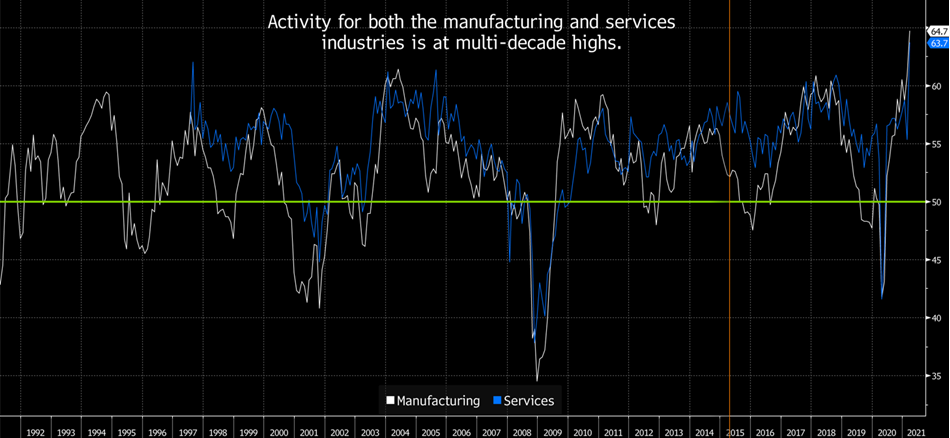
Optimism is also extraordinarily high when we look at the U.S. economy through the lenses of the manufacturing and services industries. The ISM Manufacturing and Services surveys are both near (or at) their highest all-time levels. This suggests very robust economic growth in the coming months. (In the graph below, readings above 50 point to expansion and below 50 suggest contraction.)

Biden lays out a $2.25 trillion infrastructure plan
All that, and now there’s another economic accelerant being added to the mix. President Biden unveiled a massive spending plan designed to boost the economy. Included is $620 billion for transportation infrastructure, $580 billion for manufacturing, and $400 billion for care for the elderly and people with disabilities. This spending – spread out over eight years – is expected to be paid for by an increase in the top corporate tax rate from 21% to 28% and by a minimum 21% tax on global corporate earnings. To garner more support, there’s speculation that the corporate tax rate might only be raised to 25%.
If it’s passed, higher taxes would be a hit to corporate profits, but total spending would still be a net positive for the economy.
Best year in 30?
This planned infrastructure spending is in addition to the $900 billion fiscal stimulus passed in December, and the $1.9 trillion stimulus passed in March. Together, these two spending packages resulted in checks totaling up to $2,000 being sent to millions, while the unemployed saw an extension of the $300 extra weekly jobless benefits through September.
With economic data coming in much better than expected, the reopening gathering steam, and the government spending trillions of dollars, the U.S. economy has the potential to grow 7% (or more) this year. If that comes to pass, this would be the biggest year of economic growth in more than 30 years.
But there are risks that cannot be ignored. One is uneven global vaccination progress. As mentioned earlier, the EU is significantly behind the U.S. in its vaccination campaign. Unfortunately, it’s not an exception. For example, about 11% of Brazil’s population and only 6% of India’s population have received at least one dose. Further, many countries in Africa didn’t even receive their first vaccine shipments until March.
The slow global vaccination rate could allow for many virus mutations, and this means the virus could be an economic factor for years to come.
Another risk we are closely monitoring is inflation. In the coming months, we expect that year-over-year inflation will hit some of the highest levels in years. But, as we discussed last month, we believe it will be manageable. Of course, should the secondary economic effects be more significant than our base-case scenario, we will re-evaluate this inflation outlook.
There are other factors as well, such as valuations and rising interest rates, that we are analyzing as we manage the investment mix of our clients’ personalized financial plans.
All data unless otherwise noted is from Bloomberg. Past performance does not guarantee future results. Any stock market transaction can result in either profit or loss. Additionally, the commentary should also be viewed in the context of the broad market and general economic conditions prevailing during the periods covered by the provided information. Market and economic conditions could change in the future, producing materially different returns. Investment strategies may be subject to various types of risk of loss including, but not limited to, market risk, credit risk, interest rate risk, inflation risk, currency risk and political risk.
This commentary has been prepared solely for informational purposes, and is not an offer to buy or sell, or a solicitation of an offer to buy or sell, any security or instrument or to participate in any particular trading strategy or an offer of investment advisory services. Investment advisory and management services are offered only pursuant to a written Investment Advisory Agreement, which investors are urged to read and consider carefully in determining whether such agreement is suitable for their individual needs and circumstances.
Allworth Financial and its affiliates and its employees may have positions in and may affect transactions in securities and instruments mentioned in these profiles and reports. Some of the investments discussed or recommended may be unsuitable for certain investors depending on their specific investment objectives and financial position.
Allworth Financial is an SEC-registered investment advisor that provides advisory services for discretionary individually managed accounts. To request a copy of Allworth Financial’s current Form ADV Part 2, please call our Compliance department at 916-482-2196 or via email at compliance@allworthfinancial.com.
Give yourself an advantage. Sign up to receive monthly insights from our Chief Investment Officer, and be the first to know about upcoming educational webinars. You'll also get instant access to our retirement planning checklist.
 January 12, 2024
Fourth Quarter 2023 Market Update
Allworth's Co-CEO Scott Hanson and Chief Investment Officer Andy Stout team up for this fourth quarter 2023 market update video.
Read Now December 15, 2023
December 2023 Market Update
Chief Investment Officer Andy Stout takes a look back on the year to help give perspective to what's on the horizon in 2024. At the beginning of this …
Read Now November 17, 2023
November 2023 Market Update
Chief Investment Officer Andy Stout examines whether there’s a chance the US dollar will lose its status as the world’s reserve currency. There is a …
Read Now
