
Where's the recession that Wall Street economists predicted for this year? Allworth Chief Investment Officer Andy Stout explores why the so-called experts have been so wrong.
You probably realize that dire economic predictions have become the norm, but just like the four seasons, the economy keeps plodding along.
Of course, there will be a recession eventually; however, as has always been the case, when precisely it will happen is uncertain.
Economists’ flawed projections
Even the self-proclaimed experts, those Wall Street economists, have been stumped over the past year. These economists have, on average, forecasted negative growth at some point within a few weeks of the start of every quarter this year.
The following table shows the last date the average forecast was negative, the predicted growth, and the actual growth rate.
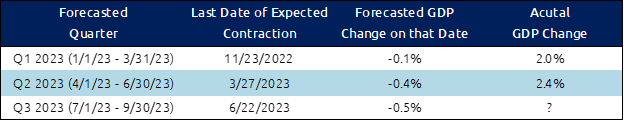
While we won’t know the actual growth rate for the third quarter of this year until the end of October, the data released so far indicates the economy is on track for another quarter of expansion. And, in case you are wondering, economists currently expect negative growth in the final quarter of 2023.
We shall see…
Economic growth deconstructed
Before we explore why economists have been so wrong, let’s dive into the latest update to GDP, or gross domestic product, which measures the total economic activity in a country. The US economy expanded by 2.4% on a quarter-over-quarter annualized basis, slightly quicker than the first quarter’s 2.0%.
Unfortunately, the underlying characteristics are not as encouraging as the 2.4% headline growth rate suggests. Consumer spending is arguably the most critical part of the economy because it represents approximately 70% of the total activity. Unfortunately, personal spending grew 1.6%, a sharp deceleration from the 4.2% in the first quarter.
A primary driver behind the overall upside GDP surprise came from a 7.7% surge in business spending on fixed investments, such as structures and equipment. The reason behind this is the three fiscal spending packages that were approved over the past few years: the $550 billion Bipartisan Infrastructure Law (November 2021), the $500 billion Inflation Reduction Act (August 2022), and the $280 billion Chips Act (August 2022).
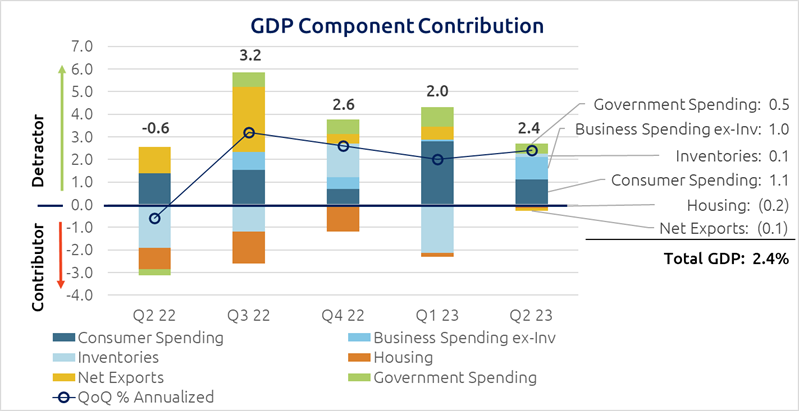
Though the total spending is spread out over multiple years, it’s starting to move the needle. Another way to gauge the effect is to analyze component contribution. Specifically, what primary expenditure types add up to that 2.4% growth rate?
This chart illustrates the economy’s main areas’ additive effect on GDP over the prior five quarters. As you can see, Business Spending ex-Inventories accounted for an unusually large 1.0 percentage points of GDP, which is in-fact the largest contribution since 2021. Moreover, the contribution rate of 41% (1% contribution /2.4% total GDP) is the highest since 2018. This economic tailwind should last for a few more years.
Why economists missed the mark
To be fair, a primary reason economists have been so wrong is that leading economic indicators have been signaling a slowdown for over a year. (Leading indicators are data that moves before the broad economy does.)
One of the more reliable leading indicators is the inverted yield curve, which occurs when short-term Treasury interest rates rise above long-term rates. As shown in the graph below, interest rates on 2-year Treasury bonds are significantly greater than those on 10-year bonds.
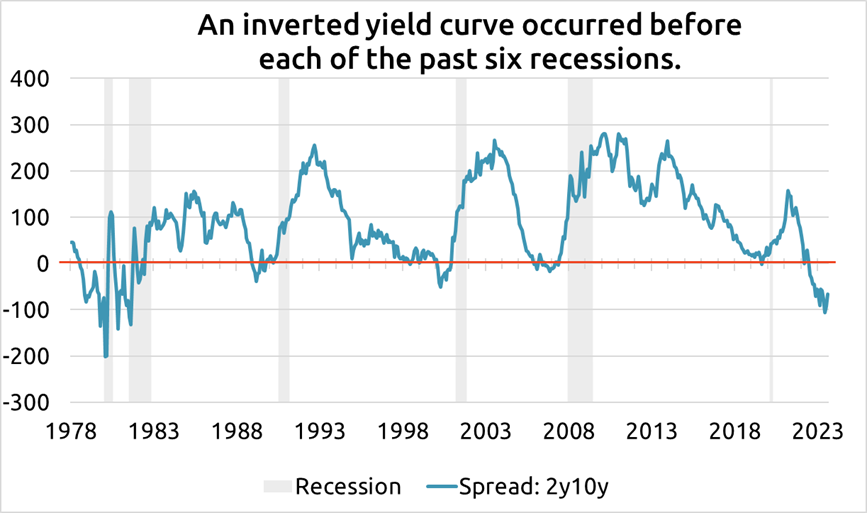
But it’s not just the yield curve that suggests elevated economic risk. Other leading indicators – housing starts, building permits, jobless claims, and business sentiment – tell a similar story.
Economic headwinds
There are a few new and old headwinds to be aware of when we discuss the broad economy. First, the Federal Reserve (Fed) has been on one of its most aggressive rate-hiking campaigns, raising rates by 5.25% in just under a year and a half. These higher interest rates weigh on the economy in many ways, notably making it more expensive for consumers to borrow, causing spending to slow.
Fortunately, the robust labor market has supported the consumer.
Although, as I previously noted, spending has been slowing. In addition, the latest batch of data on the consumer showed that revolving credit (mostly credit cards) fell by $600 million, the first monthly decline in more than two years. This suggests people might be starting to tighten their belts. Further, mortgage rates at 20-year highs will likely keep the housing market from expanding.
A material event on the horizon is the end of the three-and-a-half-year student loan forbearance program. Interest will begin to accrue in September, with some payments starting in October. This will be a big change for many people, as, according to a NerdWallet survey, approximately 88% of borrowers didn’t make any payments at all during the forbearance period.
Where we go from here
The economy has defied expectations all year and posted growth despite elevated recession risk. Some economists, including those at JP Morgan, have thrown in the towel, proclaiming the US will now avoid a recession after previously calling for one to descend this year.
There are real economic risks over the next year, however, and we take those into consideration when designing investment strategies. Rest assured, we won’t waste your time (or ours) making pointless predictions about where GDP might be at some arbitrary point in the future. As legendary economist John Kenneth Galbraith said, “The only function of economic forecasting is to make astrology look respectable.”
Instead, we’ll continue to spend our time analyzing vast amounts of economic, market, and investment data to construct a portfolio that will support your financial plan.
August 18, 2023
All data unless otherwise noted is from Bloomberg. Past performance does not guarantee future results. Any stock market transaction can result in either profit or loss. Additionally, the commentary should also be viewed in the context of the broad market and general economic conditions prevailing during the periods covered by the provided information. Market and economic conditions could change in the future, producing materially different returns. Investment strategies may be subject to various types of risk of loss including, but not limited to, market risk, credit risk, interest rate risk, inflation risk, currency risk and political risk.
This commentary has been prepared solely for informational purposes, and is not an offer to buy or sell, or a solicitation of an offer to buy or sell, any security or instrument or to participate in any particular trading strategy or an offer of investment advisory services. Investment advisory and management services are offered only pursuant to a written Investment Advisory Agreement, which investors are urged to read and consider carefully in determining whether such agreement is suitable for their individual needs and circumstances.
Allworth Financial and its affiliates and its employees may have positions in and may affect transactions in securities and instruments mentioned in these profiles and reports. Some of the investments discussed or recommended may be unsuitable for certain investors depending on their specific investment objectives and financial position.
Allworth Financial is an SEC-registered investment advisor that provides advisory services for discretionary individually managed accounts. To request a copy of Allworth Financial’s current Form ADV Part 2, please call our Compliance department at 916-482-2196 or via email at compliance@allworthfinancial.com.
 January 12, 2024
Fourth Quarter 2023 Market Update
January 12, 2024
Fourth Quarter 2023 Market Update
Allworth's Co-CEO Scott Hanson and Chief Investment Officer Andy Stout team up for this fourth quarter 2023 market update video.
Read Now December 15, 2023
December 2023 Market Update
December 15, 2023
December 2023 Market Update
Chief Investment Officer Andy Stout takes a look back on the year to help give perspective to what's on the horizon in 2024. At the beginning of this …
Read Now November 17, 2023
November 2023 Market Update
November 17, 2023
November 2023 Market Update
Chief Investment Officer Andy Stout examines whether there’s a chance the US dollar will lose its status as the world’s reserve currency. There is a …
Read Now