
With the turn of the year fast approaching, analysts are making bold predictions about where markets might be roughly one year from now (on December 31st, 2020).
These, of course, do not help you at all.
That’s not to say that it’s not useful to analyze the economy and get an understanding of where things may end up over time; however, we recognize that a possible stock price at a single point in the future doesn’t really help you.
What is beneficial is when an investment team takes the time to study the big picture and identify trends that could help the investment portion of your personalized financial plan.
When we analyze the economy and markets, we consider things like what the Federal Reserve (Fed) might do with short-term interest rates, how Brexit might evolve, what market valuations look like, how the trade war could affect the economy, and what the risk of a recession might be.
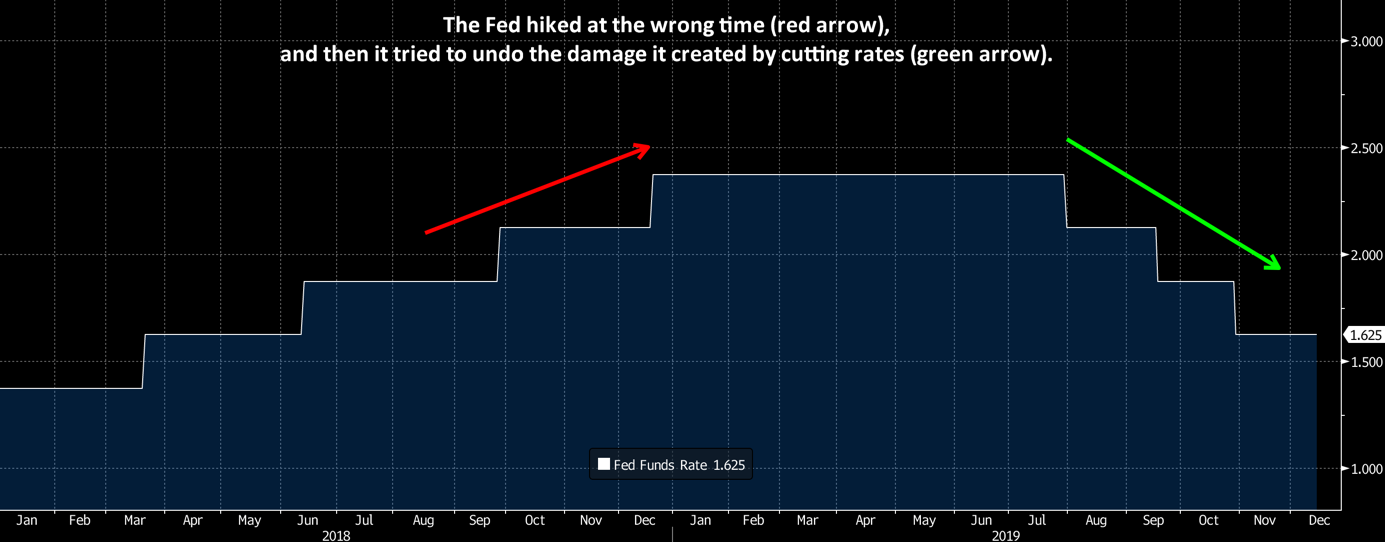
One of the most interesting facets of the above list concerns the Fed, which made an “about face” this year.
After hiking short-term interest rates four times in 2018, the Fed realized its error and cut rates three times in 2019. Those ill-advised 2018 hikes contributed to the economy slowing down.
When the Fed hikes rates (and other central banks do not), the effect can be a stronger U.S. dollar.
But when the dollar strengthens, it can have a negative impact on the U.S. economy because it makes our exports more expensive. This not only hurts multinational companies like Procter & Gamble, it also hurts manufacturers because there is less demand for U.S. made goods here in the states because the cost of imports is cheaper when the U.S. dollar is strong.
While the U.S. economy was certainly able to handle a couple of hikes in 2018, the latter hikes were a bad idea because the trade war hurt the economy at the same time the hikes kicked in. This one-two punch forced the Fed to cut rates three times this year.
Fortunately, spending from consumers like you managed to keep the economy growing in 2019, albeit it at a modest rate.
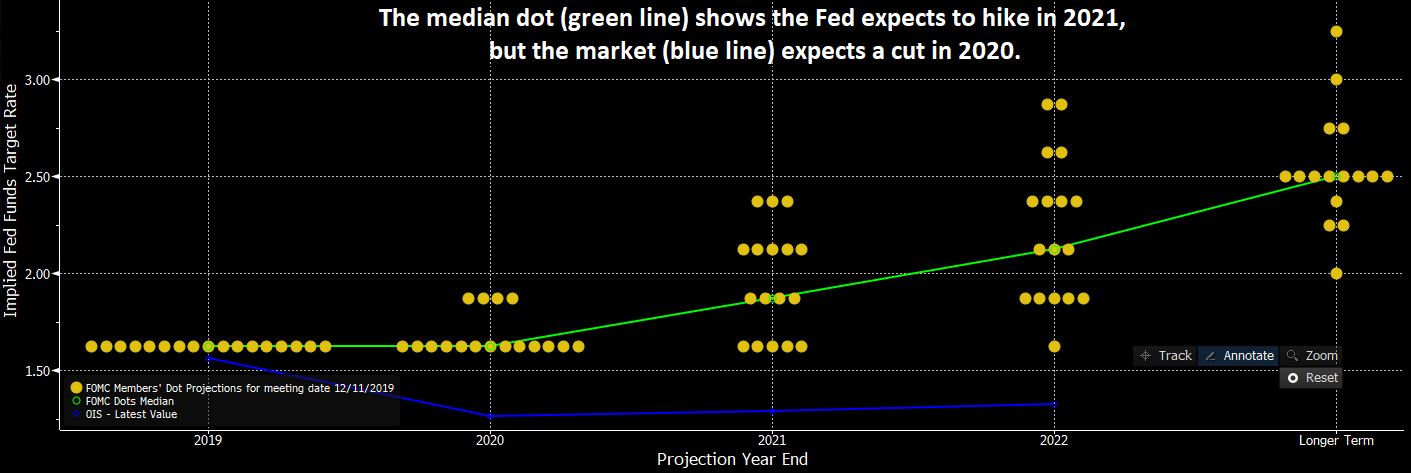
At the Fed’s most recent meeting, the committee provided its quarterly update of where it thinks short-term interest rates will be over the next few years via the ‘Dot Plot.’ In the Dot Plot, each member gives their anonymous view on where rates should be at the end of each of the next few years.
By analyzing the median dot from the Fed, you can get an idea of the collective view of its members. The median dot shows that the next move from the Fed will be a hike in 2021. The market, however, believes the next move will be a cut in 2020.

What this means for you is that there is a good chance this low interest rate environment will continue for some time. This comes with good news and bad news: The good is that mortgage rates should stay low. The bad is that CD rates and yields on your savings account will also probably stay low.
For the bond portion of your investment mix, there is some good and bad, as well.
The good is that because bond prices and interest rates move in opposite directions, low rates should keep your bond prices high. The bad news is that the income generated from these bonds will continue to be low.
Another thing on people’s minds is a possible recession.
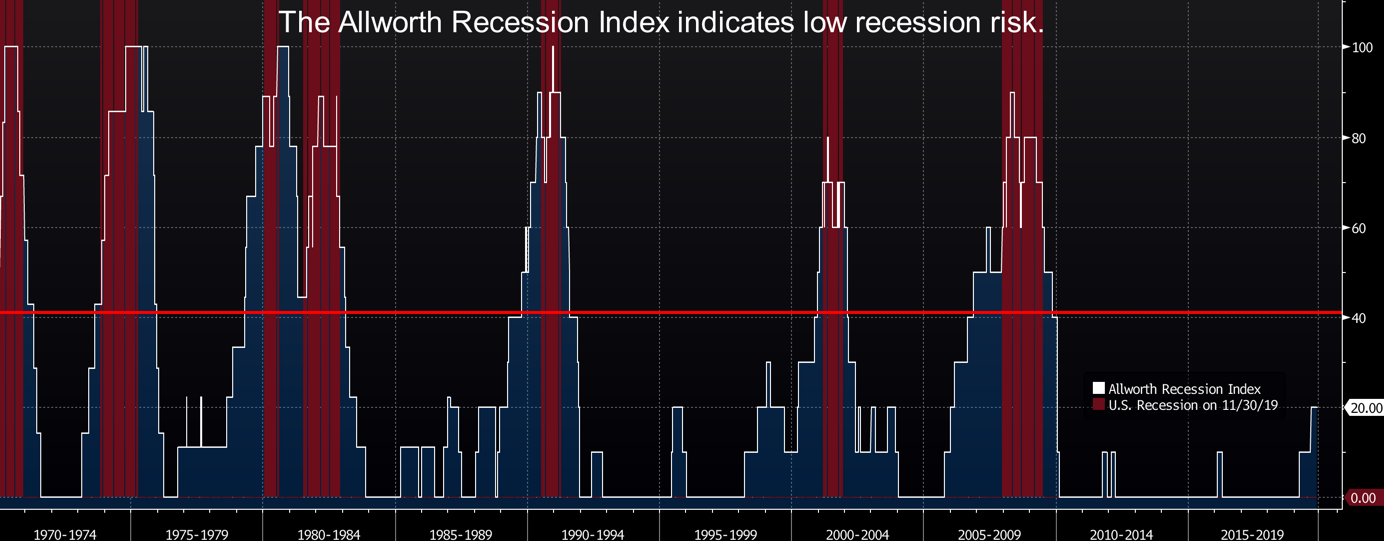
At Allworth Financial, we’ve created our own proprietary recession index. It’s made of leading economic indicators that represent different parts of the economy, including interest rates, housing, jobs and confidence. Leading economic indicators are data points that move before the broad economy moves.
When we combine these individual indicators into one, they form a powerful index that has historically alerted of a slowdown about eight months before the onset of a recession. Currently, only the inversion of the yield curve from earlier in the year has raised a red flag. (A yield curve inversion occurs when long-term rates are below short-term rates.)
The other leading indicators are still pointing toward expansion, but there is some risk in consumer confidence. Business confidence, housing, and jobs are all suggesting the record-long economic expansion will continue.
The Allworth Recession Index would indicate a recession is likely in the near term (6 months or so) when more than 40% of the indicators point to a recession.
Currently, just 20% of the underlying components are signaling a slowdown.
At Allworth Financial, we will continue to monitor the economy and markets. However, we won’t pay any attention to meaningless predictions of where the Dow Jones Industrial Average could be at some random date in the future – and neither should you.
All data from Bloomberg. The Allworth Recession Index is made up of leading economic indicators, which are data points that have historically moved before the economy. The index value is calculated as a percent of the indicators that are sending signals that suggests recession risk is elevated. When the index value is greater than 40%, we believe there is a greater chance for a recession in the next six to nine months. All data begins by 1971 unless noted below. The indicators that make up the Allworth Recession Index are the 3-Month Government Bond Yield, 2-Year Government Bond Yield (beginning in 1976), 10-year Government Bond Yield, BarCap US Corp HY YTW – 10 Year Spread (beginning in 1987), Conference Board Consumer Confidence, Consumer Price Index, NFIB Small Business Job Openings Hard to Fill (beginning in 1976), Private Housing Authorized by Building Permits by Type, US Federal Funds Effective Rate, US Initial Jobless Claims, US New Privately Owned Housing Units Started by Structure, and US Unemployment Rates.
Past performance does not guarantee future results. Any stock market transaction can result in either profit or loss. Additionally, the commentary should also be viewed in the context of the broad market and general economic conditions prevailing during the periods covered by the provided information. Market and economic conditions could change in the future, producing materially different returns. Investment strategies may be subject to various types of risk of loss including, but not limited to, market risk, credit risk, interest rate risk, inflation risk, currency risk and political risk.
This commentary has been prepared solely for informational purposes, and is not an offer to buy or sell, or a solicitation of an offer to buy or sell, any security or instrument or to participate in any particular trading strategy or an offer of investment advisory services. Investment advisory and management services are offered only pursuant to a written Investment Advisory Agreement, which investors are urged to read and consider carefully in determining whether such agreement is suitable for their individual needs and circumstances.
Allworth Financial and its affiliates and its employees may have positions in and may affect transactions in securities and instruments mentioned in these profiles and reports. Some of the investments discussed or recommended may be unsuitable for certain investors depending on their specific investment objectives and financial position.
Allworth Financial is an SEC-registered investment advisor that provides advisory services for discretionary individually managed accounts. To request a copy of Allworth Financial’s current Form ADV Part 2, please call our Compliance department at 916-482-2196 or via email at compliance@allworthfinancial.com.
December 20, 2019
 January 12, 2024
Fourth Quarter 2023 Market Update
January 12, 2024
Fourth Quarter 2023 Market Update
Allworth's Co-CEO Scott Hanson and Chief Investment Officer Andy Stout team up for this fourth quarter 2023 market update video.
Read Now December 15, 2023
December 2023 Market Update
December 15, 2023
December 2023 Market Update
Chief Investment Officer Andy Stout takes a look back on the year to help give perspective to what's on the horizon in 2024. At the beginning of this …
Read Now November 17, 2023
November 2023 Market Update
November 17, 2023
November 2023 Market Update
Chief Investment Officer Andy Stout examines whether there’s a chance the US dollar will lose its status as the world’s reserve currency. There is a …
Read Now