Allworth Chief Investment Officer Andy Stout outlines the economic data we're watching as Russia continues its invasion of Ukraine.
First and foremost, we at Allworth must acknowledge that Russia’s unprovoked war on Ukraine has caused a tragic humanitarian crisis. Events are unfolding quickly, there is much uncertainty, and the news from abroad is not good.
Needless to say, even though we have a job to do, we stand with the people of Ukraine at this time, and we are all monitoring the situation with heavy hearts.
For March’s Monthly Market Update, I want to share what Allworth’s Investment Committee is currently analyzing from an economic perspective, as it relates to the impact of the war.
Inflation
Thus far, economically, the most apparent impact of the war in Ukraine here in the United States is on inflation. You already see higher prices at the gas pump, grocery store, and many other places.
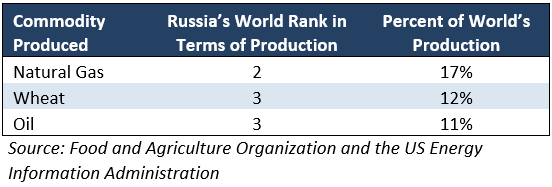
The reason for this is simple: Because they are a major commodity producer, many regions of the world are hurrying to reduce their reliance on Russia. For example, the US announced it was cutting off Russian oil and natural gas imports. Moreover, the European Union plans to reduce its dependency on Russian gas by two-thirds this year.

The result of the war has been a spike in these three key commodities. (And many others, as well.) To illustrate, the national average cost of gasoline recently hit a record high at $4.33 per gallon.
Prior to Russia’s invasion, inflation was primed to move lower. However, it’s now likely to worsen before improving in the second half of the year.
The consumer price index (CPI) hit a 40-year high in February, climbing 7.9% over the past year. Unfortunately, according to the Federal Reserve Bank of Cleveland, year-over-year inflation is tracking at 8.4%. Economists expect the CPI to drop in the months ahead, settling around 6% by year-end.
These higher prices will likely constrain consumer spending, which would hurt the US economy because consumer spending represents about 70% of the total economy. Europe will take a bigger economic hit because it relies on Russia for about 40% of its natural gas imports. Further, the geographic proximity of Russia could hurt Europe’s consumer confidence. That, in turn, would negatively affect growth.
The Federal Reserve is in a tough spot
The "dual mandate" of our nation's central bank is stable inflation and full employment. And while we are at full employment we are obviously far from stable in terms of inflation.
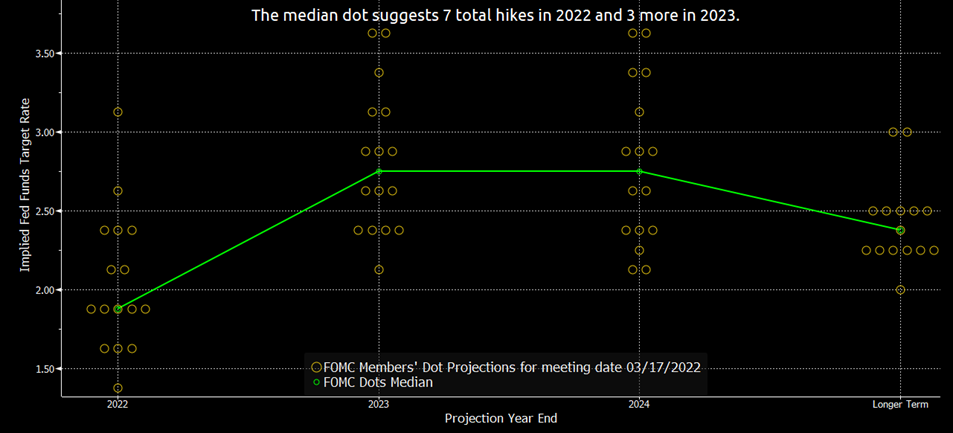
To fight inflation, the Fed increased short-term interest rates (known as the "fed funds rate") for the first time in three years on March 16. Moreover, the central bank indicated it would raise interest rates six more times this year. We observe the Fed’s intentions through the median, or middle, dot of the "dot plot."
The dot plot is a graphical representation showing where each Fed member believes the fed funds rate should be at the end of the upcoming calendar years. Market participants view the median dot as the Fed’s consensus opinion on rate hikes.

Unfortunately, rate hikes won’t help with headwinds from the war or supply chain dislocations. Higher rates will help reduce inflation from other sources, but it typically works with a lag of about 6-12 months. At the same time, should the Fed end up raising rates too quickly, it could slow down the economy.
Based on current economic data, the US can withstand the Fed’s rate hikes. Economists expect the US economy to grow about 2.5%-3% for all of 2022. However, the first quarter might be the weakest quarter of the year, with growth currently forecasted at 1.5%.
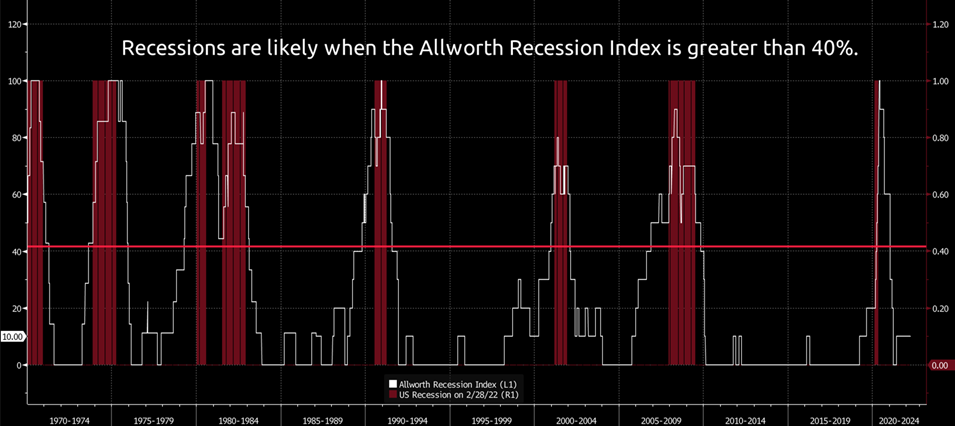
Not surprisingly, the war, rising inflation, and the Fed hiking rates have increased the risk of a recession. Yes, with history as a guide, a recession will eventually occur; it’s a normal part of the business cycle, after all. However, leading economic indicators suggest low recession risk over the next 3-6 months.
Our proprietary Allworth Recession Index is made up of 10 economic data points that tend to move before the broad economy moves. Currently, only one of the 10 is signaling a slowdown.

However, I must note that another leading indicator might flip in the not-too-distant future. The 2–10-year yield curve measures the difference in interest rates on the 2-year Treasury and the 10-year Treasury. When rates on the 2-year are greater than the 10-year, the yield curve inverts, suggesting a heightened risk of a slowdown.
Even if this happens, that will mean just two leading indicators would be pointing to a recession. Historically, recession risk wasn’t high until at least four of our leading indicators flagged a slowdown.
Client exposure to Russia and what we’re doing
Understandably, investors don’t want to own Russian stocks, and, with that in mind, we are proud to say that our managed portfolios do not have any Russian stock exposure. Not only have Russian equities been removed from the underlying indexes, but their stock market is uninvestable.
Further, we are focusing on the things we can control. For example, just to name one, specifically for clients, in many of our taxable managed accounts, we have been taking advantage of the market turbulence to reduce your tax bill by actively tax-loss harvesting.
The Allworth Investment Committee will continue to analyze the impact of the war and make any portfolio changes we feel are in the best interests of the people we serve.
March 18, 2022
All data unless otherwise noted is from Bloomberg. Past performance does not guarantee future results. Any stock market transaction can result in either profit or loss. Additionally, the commentary should also be viewed in the context of the broad market and general economic conditions prevailing during the periods covered by the provided information. Market and economic conditions could change in the future, producing materially different returns. Investment strategies may be subject to various types of risk of loss including, but not limited to, market risk, credit risk, interest rate risk, inflation risk, currency risk and political risk.
This commentary has been prepared solely for informational purposes, and is not an offer to buy or sell, or a solicitation of an offer to buy or sell, any security or instrument or to participate in any particular trading strategy or an offer of investment advisory services. Investment advisory and management services are offered only pursuant to a written Investment Advisory Agreement, which investors are urged to read and consider carefully in determining whether such agreement is suitable for their individual needs and circumstances.
Allworth Financial and its affiliates and its employees may have positions in and may affect transactions in securities and instruments mentioned in these profiles and reports. Some of the investments discussed or recommended may be unsuitable for certain investors depending on their specific investment objectives and financial position.
Allworth Financial is an SEC-registered investment advisor that provides advisory services for discretionary individually managed accounts. To request a copy of Allworth Financial’s current Form ADV Part 2, please call our Compliance department at 916-482-2196 or via email at compliance@allworthfinancial.com.
Give yourself an advantage. Sign up to receive monthly insights from our Chief Investment Officer, and be the first to know about upcoming educational webinars. You'll also get instant access to our retirement planning checklist.
 January 12, 2024
Fourth Quarter 2023 Market Update
Allworth's Co-CEO Scott Hanson and Chief Investment Officer Andy Stout team up for this fourth quarter 2023 market update video.
Read Now December 15, 2023
December 2023 Market Update
Chief Investment Officer Andy Stout takes a look back on the year to help give perspective to what's on the horizon in 2024. At the beginning of this …
Read Now November 17, 2023
November 2023 Market Update
Chief Investment Officer Andy Stout examines whether there’s a chance the US dollar will lose its status as the world’s reserve currency. There is a …
Read Now
