
A recent study revealed that just 20% of Americans believe stocks will be the best investment over the next 10 years1. Clearly, people are worried about the trade war, Brexit, and the possibility of a recession, just to name a few.
Over the long term, however, stocks have historically proven to be an excellent investment choice.
When looking at every 10-year period over the past 50 years, large-cap stocks were higher 96% of the time. Of course, some periods were better than others, and many people look to valuations like the price-to-earnings ratio (or P/E ratio) to determine if stocks are attractive or unattractive.
The P/E ratio for large-cap stocks is 19.6, and that number is elevated in many people’s minds. But this is true if you only compare it to its long-term average; for example, the 50-year average P/E ratio is 16.8. However, this type of analysis is far too simple.
One adjustment we make is to incorporate the current interest-rate environment. We do this by looking at what’s called the equity risk premium, or ERP. The ERP is simply the extra return expected above the risk-free rate. It’s calculated by reducing the earnings yield by government bond interest rates (the earnings yield is earnings divided by price, which is the inverse of the P/E ratio). The higher the ERP, the more attractive stocks are.
Over the past 50 years, the ERP has averaged about 0.4%, with a range of -5.1% to 6.2%. We believe the current reading of 3.4% - thanks to the low-interest rate environment – suggests stocks are relatively attractive for long-term investors.
This does not mean there won’t be volatility as there are many things we are watching closely – such as recession risk – that could make stocks less attractive.
One reason we watch recession risk is that when recessions occur, corporate profits tend to suffer. We believe earnings, which affect valuations, are one of the main factors to monitor when it comes to how well stocks might perform in the future.
We are now at the beginning of earnings season, and Wall Street analysts are not optimistic. They estimate that earnings will have declined in the third quarter of 2019 by about 4% (compared to this time last year).
To be fair, it’s a long-standing tradition for companies to revise lower earnings forecasts heading into earnings season and then beat those reduced estimates. Over the past five years, analysts predicted quarterly earnings growth for large-cap companies would have been about 3.2% per quarter, but earnings grew 7.2%.
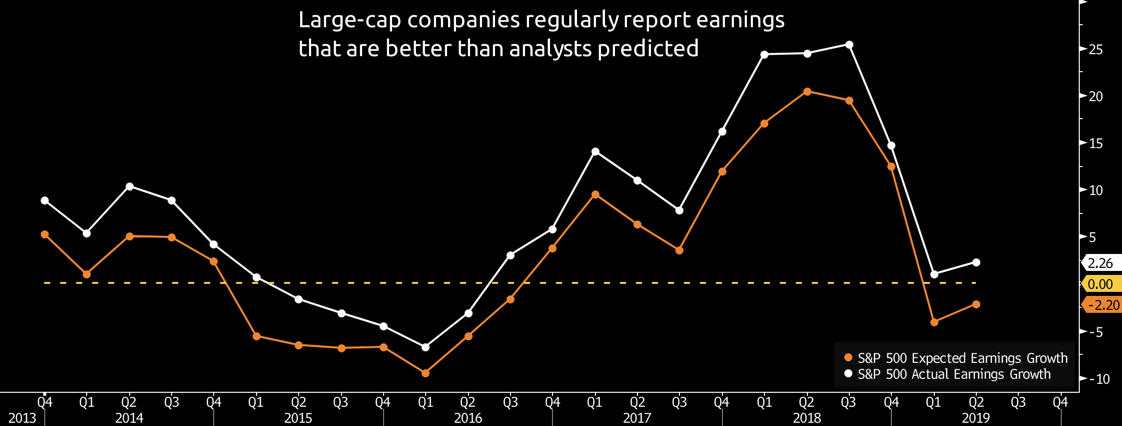

In other words, on average, earnings grew four percentage points more than what was expected. If that trend holds, earnings should be relatively unchanged for the third quarter (compared to a year ago).
Taking a broad look at the U.S. economy shows slowing economic growth but nothing recessionary. The trade war is affecting the manufacturing sector, which can be seen in the ISM Manufacturing Survey. The most recent update was the lowest since early 2009, and it suggests the sector is contracting. Fortunately, manufacturing only accounts for about 8% of the U.S. workforce.
Consumer spending has been keeping the economy afloat over the past few years. After all, spending from consumers like you accounts for about 70% of total economic growth. If the job market continues to grow, consumer spending should, as well.
One of the potential economic risks we are watching includes lower consumer and business confidence due to fallout from the trade war. Should confidence weaken, we would expect spending to follow suit.
Trying to predict the trade war is difficult, to say the least. Because financial headlines are often full of noise intended to elicit fear, in response, we created the Allworth Recession Index. This index is made up of individual leading economic indicators, which are indicators that move before the broad economy.
The Allworth Recession Index is currently at 20, meaning that only 20% of our major leading indicators are flying a red flag. (Historically, when this index rose above 40, recessions followed about eight months later.)
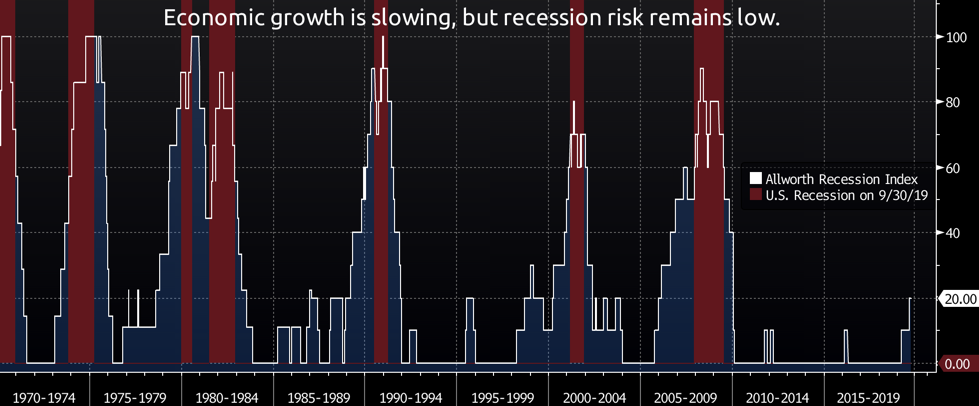
The only indicators that are currently warning of a slowdown are interest rate spreads, which compare yields on short-term bonds to long-term bonds. Because some short-term rates are higher than long-term rates, part of the yield curve is considered inverted. On average, an inverted yield curve has preceded a recession by about 17 months. Our other leading indicators that track housing, the job market, inflation, and sentiment are not pointing toward an impending recession.
The bottom line is that the manufacturing slowdown has not yet negatively affected the job market, and this has helped keep recession fears in check. But keep in mind, over the past 50 years, there have been seven recessions, and another one will eventually take place.
Please note, your personalized financial plan is constructed to help you navigate a recession and enjoy a better retirement.
1. Bankrate. https://www.bankrate.com/investing/financial-security-july-2019/
All data from Bloomberg. The Allworth Recession Index is made up of leading economic indicators, which are data points that have historically moved before the economy. The index value is calculated as a percent of the indicators that are sending signals that suggests recession risk is elevated. When the index value is greater than 40%, we believe there is a greater chance for a recession in the next six to nine months. All data begins by 1971 unless noted below. The indicators that make up the Allworth Recession Index are the 3-Month Government Bond Yield, 2-Year Government Bond Yield (beginning in 1976), 10-year Government Bond Yield, BarCap US Corp HY YTW – 10 Year Spread (beginning in 1987), Conference Board Consumer Confidence, Consumer Price Index, NFIB Small Business Job Openings Hard to Fill (beginning in 1976), Private Housing Authorized by Building Permits by Type, US Federal Funds Effective Rate, US Initial Jobless Claims, US New Privately Owned Housing Units Started by Structure, and US Unemployment Rates.
Past performance does not guarantee future results. Any stock market transaction can result in either profit or loss. Additionally, the commentary should also be viewed in the context of the broad market and general economic conditions prevailing during the periods covered by the provided information. Market and economic conditions could change in the future, producing materially different returns. Investment strategies may be subject to various types of risk of loss including, but not limited to, market risk, credit risk, interest rate risk, inflation risk, currency risk and political risk.
This commentary has been prepared solely for informational purposes, and is not an offer to buy or sell, or a solicitation of an offer to buy or sell, any security or instrument or to participate in any particular trading strategy or an offer of investment advisory services. Investment advisory and management services are offered only pursuant to a written Investment Advisory Agreement, which investors are urged to read and consider carefully in determining whether such agreement is suitable for their individual needs and circumstances.
Allworth Financial and its affiliates and its employees may have positions in and may affect transactions in securities and instruments mentioned in these profiles and reports. Some of the investments discussed or recommended may be unsuitable for certain investors depending on their specific investment objectives and financial position.
Allworth Financial is an SEC-registered investment advisor that provides advisory services for discretionary individually managed accounts. To request a copy of Allworth Financial’s current Form ADV Part 2, please call our Compliance department at 916-482-2196 or via email at compliance@allworthfinancial.com.
October 18, 2019
 January 12, 2024
Fourth Quarter 2023 Market Update
January 12, 2024
Fourth Quarter 2023 Market Update
Allworth's Co-CEO Scott Hanson and Chief Investment Officer Andy Stout team up for this fourth quarter 2023 market update video.
Read Now December 15, 2023
December 2023 Market Update
December 15, 2023
December 2023 Market Update
Chief Investment Officer Andy Stout takes a look back on the year to help give perspective to what's on the horizon in 2024. At the beginning of this …
Read Now November 17, 2023
November 2023 Market Update
November 17, 2023
November 2023 Market Update
Chief Investment Officer Andy Stout examines whether there’s a chance the US dollar will lose its status as the world’s reserve currency. There is a …
Read Now