
Allworth Chief Investment Officer Andy Stout discusses today’s economy, the risks we face, and what this means for your investment mix.
Are you a glass half full or a glass half empty type of person? That difference of perspective could either mean that the economy looks great to you, or that it’s on the verge of collapse.
As for the investment team at Allworth, and myself, we see the glass is currently at about 50 percent of its capacity. It’s absolutely critical to look at the economy and markets objectively. Otherwise, a decision based on emotion instead of facts could occur.
So, with that in mind, let’s look at the economy and explore some potential risks.
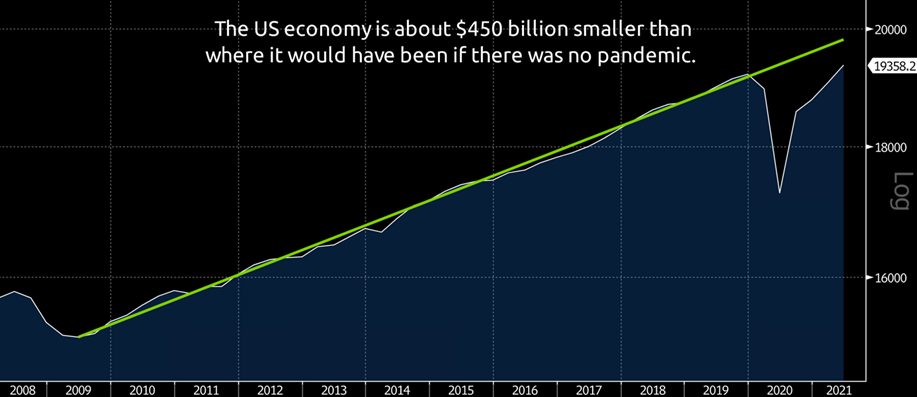
The size of the US economy has eclipsed pre-pandemic levels.
US gross domestic product (or GDP) was $19.2 trillion at the end of 2019. Then the economy came crashing to a halt, and GDP plunged to $17.2 trillion. Since climbing 6.5 percent on an annualized basis in the April to June period, GDP is now at $19.4 trillion.
While the economy – as measured by GDP – has recovered to where it was, it’s still far short of where it should be in the absence of the pandemic.
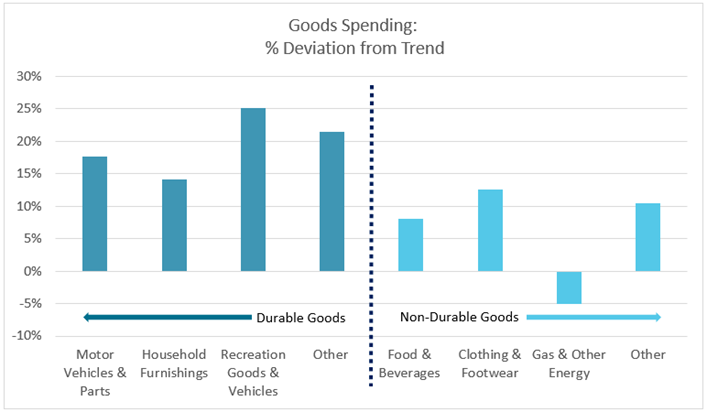
The recovery – while strong – has been uneven in terms of which components have recovered. Consumer spending can be broken down into two major categories: goods and services. Looking at where these would be relative to their “trend” shows how the underlying economic landscape has shifted.
Overall, goods consumption is 13 percent higher compared to trend, while services spending is 6 percent lower. Even though the percent increase in goods is more than the percent decrease in services, total spending is lower than trend because the dollar amount of services consumption is greater than that of goods.
Even within goods, there is a discernible difference between how much consumers are spending on durable goods compared to non-durable goods. It makes intuitive sense that durable goods spending is outpacing its non-durable counterpart because these bigger ticket items are where people will spend their money when the government is flooding the economy with cash via low interest rates and stimulus checks.
Meanwhile, service spending is well below where it ought to be, with utilities and financial spending being the exceptions. To be fair, these categories didn’t see much of a hit at the worst of the crisis.
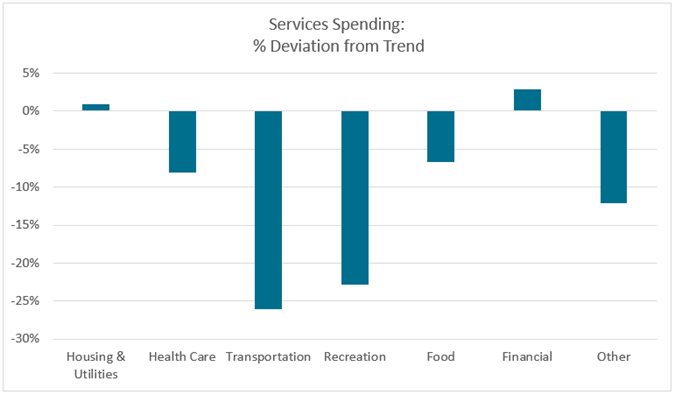
What stands out is transportation and recreation spending. The reason for this is that consumers have been reluctant to be near other people. In other words, people aren’t piling into an Uber to go to a crowded concert (yet).
So, while the economy might be at pre-crisis levels, a full spending recovery is far from complete. Another area where the recovery is still ongoing is the labor market.
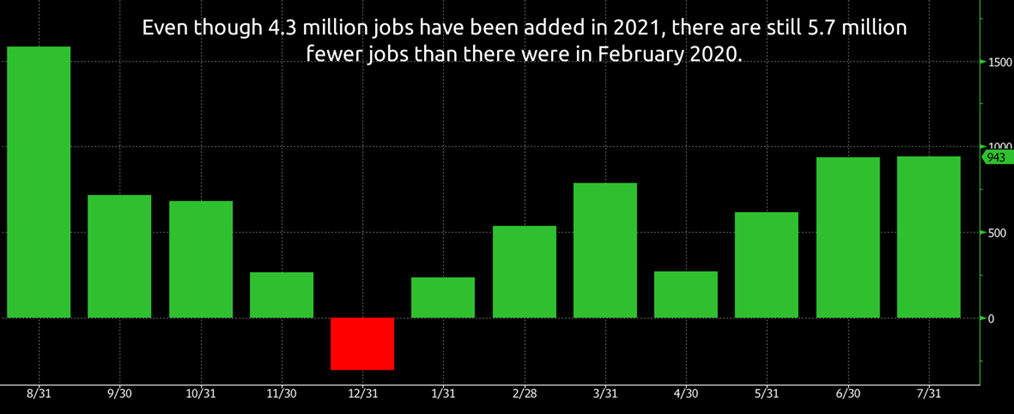
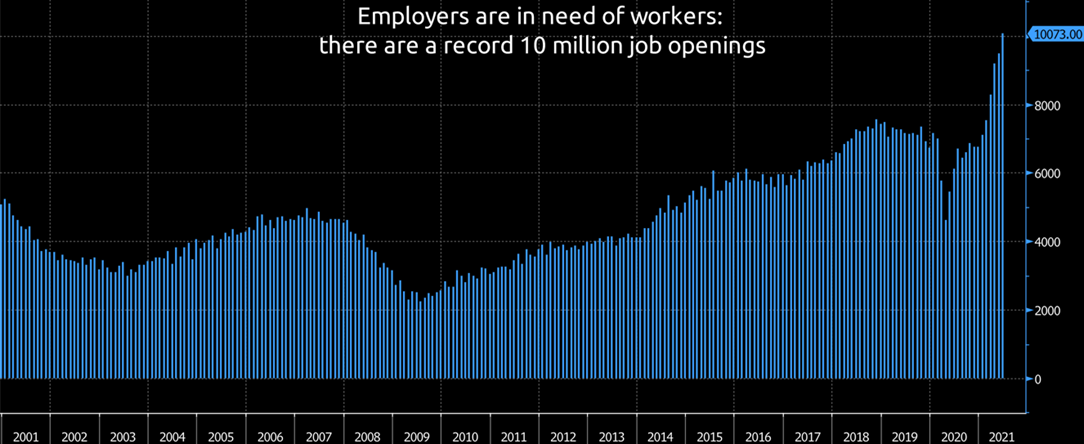
The job market is picking up steam, but there is still a way to go.
Not only were the 943,000 jobs that were added in July the most since last August, but it was also the second straight month with job gains above 900,000. There is still much room for improvement because the economy is still about 5.7 million jobs shy of pre-pandemic levels.
Layoffs have remained relatively low over the past two months, with most of the recent releases showing fewer than 400,000 initial jobless claims. While some analysts think the Delta COVID variant could cause layoffs to increase, the fact that there are more than 10 million job openings (the most ever) suggests employers won’t layoff more people than normal because they are already having enough trouble finding qualified workers.
It appears possible that job openings will drop in the months after Labor Day because that’s when the extra $300 in weekly emergency unemployment benefits will expire in about half the states, including California and New York. If someone is making more money by not working, it’s logical that many people would choose not to work.
While the economy is poised for a strong 2021 as the recovery continues, there are risks.
Risk 1: Tapering
The Federal Reserve (Fed), our nation’s central bank, is indicating that it will soon announce that its monthly bond purchases will be reduced. The Fed is currently buying $120 billion of bonds ($80 billion of Treasuries + $40 billion of mortgage-backed securities) each month. The purpose is to keep long-term interest rates low and encourage consumer spending. When the Fed begins to slow down its monthly purchases, probably late in 2021 or early in 2022, there could be a temporary bout of market turbulence.
Risk 2: Inflation
Inflation is high today, but will it stay high? The most likely scenario is that inflation returns to lower levels in early 2022 as the demand from the reopening begins to dissipate and supply chain dislocations normalize. However, there is a chance that companies end up passing along higher costs to consumers, which could mean that elevated inflation stays with us for longer than expected. If that’s the case, the Fed could end up raising short-term interest rates earlier and quicker than most expect.
Risk 3: COVID-19 Variants
We are all seeing how the Delta variant is affecting the world around us. This highly contagious strain has an estimated R0 of between five and 10. This means that each infected person could spread the virus to five to 10 unprotected people. On top of that, there have been more than 100,000 breakthrough cases (those vaccinated but infected). While the vaccination rate has been increasing lately and the vaccines are holding up relatively well, there is no guarantee that will be the case for the next variant.
Risk 4: Geopolitical Tensions
Relations with China have deteriorated, and the country seems to be taking steps to squash anything that could challenge the power of the state. Examples of this include China’s crackdown on IPO listings and for-profit education companies. If tensions with China get worse, it could harm our trade with them, and China is our largest trading partner.
Risk 5: The Unknown Unknowns
This could be anything we don’t know about, and so, by extension, don’t know what the economic response would be. If you think back to late 2019, a perfect example of an unknown unknown would have been COVID-19.
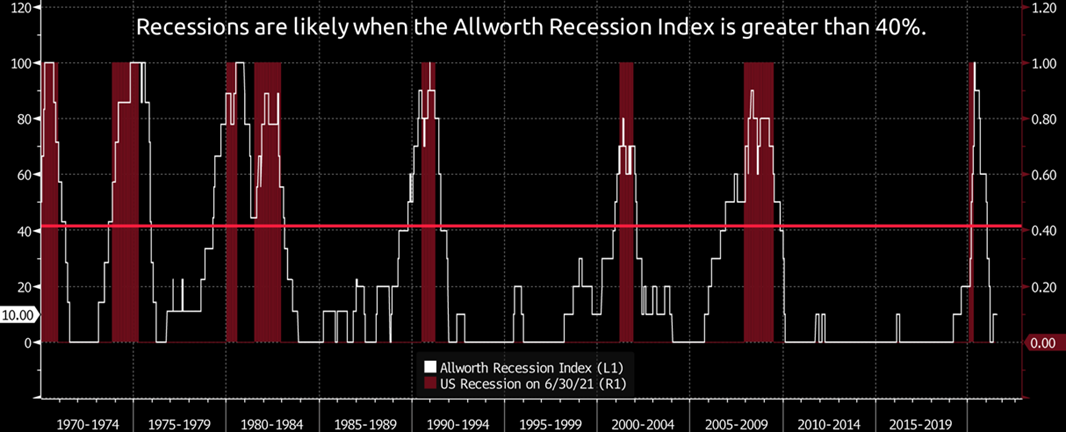
While these are real risks that must be considered, that doesn’t mean the economy is about to slip into a recession. Analyzing leading economic indicators allows us to objectively measure recession risk over the next six-to-nine months. Leading indicators are data points that move before the broad economy moves.
At Allworth Financial, we’ve created a proprietary recession index that has historically flagged a slowdown about eight months before the onset of a recession.
What does this mean for you?
The good news is that the economy is on solid footing and the risk of a recession in the next six-to-nine months is low. However, things can change very quickly. It’s necessary to have your investments constantly monitored to ensure they’re appropriate for the ever-changing economic environment. That’s what the investment team here at Allworth does for our clients every day. This allows them to closely work with their advisor on their personalized financial plan, which serves as a guide to and through retirement.
August 13, 2021
All data unless otherwise noted is from Bloomberg. The Allworth Recession Index is made up of leading economic indicators, which are data points that have historically moved before the economy. The index value is calculated as a percent of the indicators that are sending signals that suggests recession risk is elevated. When the index value is greater than 40%, we believe there is a greater chance for a recession in the next six to nine months. All data begins by 1971 unless noted below. The indicators that make up the Allworth Recession Index are the 3-Month Government Bond Yield, 2-Year Government Bond Yield (beginning in 1976), 10-year Government Bond Yield, BarCap US Corp HY YTW – 10 Year Spread (beginning in 1987), Conference Board Consumer Confidence, Consumer Price Index, NFIB Small Business Job Openings Hard to Fill (beginning in 1976), Private Housing Authorized by Building Permits by Type, US Federal Funds Effective Rate, US Initial Jobless Claims, US New Privately Owned Housing Units Started by Structure, and US Unemployment Rates.
Past performance does not guarantee future results. Any stock market transaction can result in either profit or loss. Additionally, the commentary should also be viewed in the context of the broad market and general economic conditions prevailing during the periods covered by the provided information. Market and economic conditions could change in the future, producing materially different returns. Investment strategies may be subject to various types of risk of loss including, but not limited to, market risk, credit risk, interest rate risk, inflation risk, currency risk and political risk.
This commentary has been prepared solely for informational purposes, and is not an offer to buy or sell, or a solicitation of an offer to buy or sell, any security or instrument or to participate in any particular trading strategy or an offer of investment advisory services. Investment advisory and management services are offered only pursuant to a written Investment Advisory Agreement, which investors are urged to read and consider carefully in determining whether such agreement is suitable for their individual needs and circumstances.
Allworth Financial and its affiliates and its employees may have positions in and may affect transactions in securities and instruments mentioned in these profiles and reports. Some of the investments discussed or recommended may be unsuitable for certain investors depending on their specific investment objectives and financial position.
Allworth Financial is an SEC-registered investment advisor that provides advisory services for discretionary individually managed accounts. To request a copy of Allworth Financial’s current Form ADV Part 2, please call our Compliance department at 916-482-2196 or via email at compliance@allworthfinancial.com.
 January 12, 2024
Fourth Quarter 2023 Market Update
January 12, 2024
Fourth Quarter 2023 Market Update
Allworth's Co-CEO Scott Hanson and Chief Investment Officer Andy Stout team up for this fourth quarter 2023 market update video.
Read Now December 15, 2023
December 2023 Market Update
December 15, 2023
December 2023 Market Update
Chief Investment Officer Andy Stout takes a look back on the year to help give perspective to what's on the horizon in 2024. At the beginning of this …
Read Now November 17, 2023
November 2023 Market Update
November 17, 2023
November 2023 Market Update
Chief Investment Officer Andy Stout examines whether there’s a chance the US dollar will lose its status as the world’s reserve currency. There is a …
Read Now