
Allworth's Chief Investment Officer, Andy Stout, shares a look back at the U.S. economy over the last decade - and explains how analyzing several data points helps us get a better idea of what may lie ahead.
Do you remember where you were on January 1st, 2010?
Not specifically?
I was at my home with my family watching the Rose Bowl between Oregon and Ohio State.
Looking back, I remember two things: First, I remember that Ohio State won. And, second, I distinctly remember wondering what the next decade might bring.
It’s not surprising that I recall those thoughts from 10 years ago, because in January of 2010, the Great Recession had ended only six months earlier, and a lot of people thought it was only a matter of time before the financial system collapsed.
Fortunately, the next decade turned out to be pretty good.
In fact, with its numerous milestones, what the 2010s introduced to us was the longest economic recovery in history (and it’s still going).
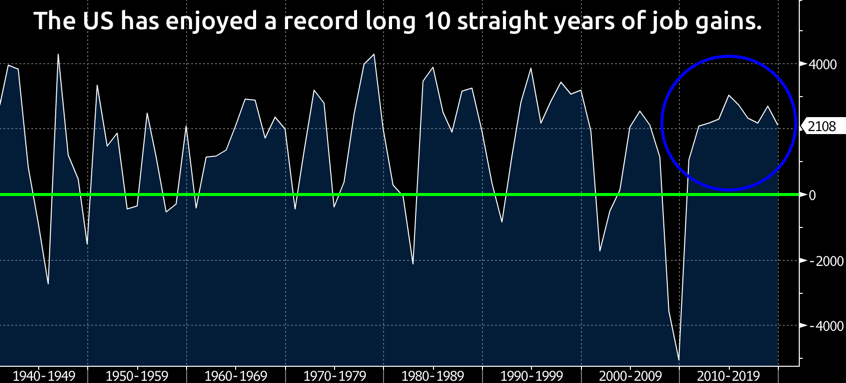
One highlight was the job market.
Last year (2019), the U.S. economy added 2.1 million new jobs, making it the 10th straight year of net gains. In fact, since this data first began to be collected back in 1939, the U.S. had never enjoyed 10 consecutive years of gains.

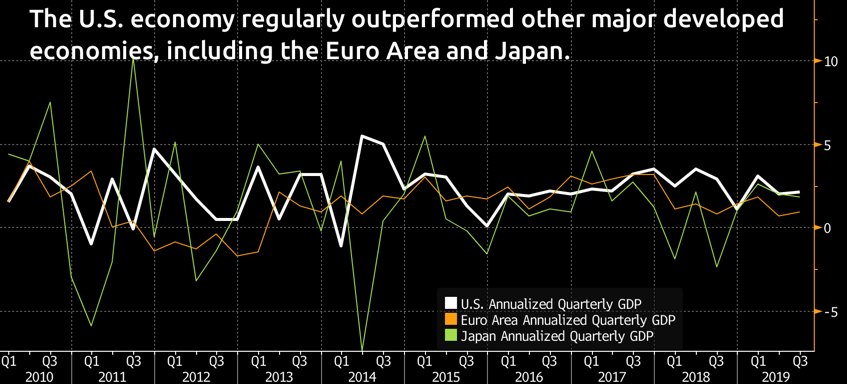
Yet, over the last decade, it isn’t just job gains that have been exceptional, it’s the entire economy.
When compared to other major developed economies (as opposed to emerging economies), U.S. economic growth has been vastly superior. In the 2010s, the average annualized quarterly economic growth rate was 2.3% here in the U.S., but just 1.4% in the Euro Area, and only 1.2% in Japan.
In part, Europe struggled due to its sovereign debt crisis, as some governments were unable to pay back the money they’ve borrowed. (The biggest debt concerns came from the group of countries known by the acronym PIIGS, which are Portugal, Italy, Ireland, Greece, and Spain.)
Another issue impacting Europe’s growth was the United Kingdom’s decision to leave the EU. That not only raised the risk of a European recession, it also introduced the possibility that other countries might withdraw, as well. This unrealized risk weighed on sentiment, which had a negative effect on the economy.
Of course, over the past decade, the U.S. was not without its share of concerns. For instance, citing both political risks and our large debt burden, in 2011, the rating agency Standard & Poor’s downgraded the United States’ credit rating from the highest rating (AAA) to the second-highest rating (AA+).
It was the first time in history the United States’ credit rating had been lowered.
Then there was 2019. Just last year, one of the more reliable “leading economic indicators” sounded the alarm when the yield curve inverted. (A leading economic indicator is a data point that moves before the broad economy moves.)
An inverted yield curve occurs when short-term interest rates move higher than long-term interest rates. This type of yield curve is unusual because, typically, long-term bonds are considered riskier than short-term bonds, and so they have higher yields.
When this inversion has occurred in the past, a recession has usually followed about 17 months later.
Keeping that in mind, there are a few reasons why this is a good thing to understand. The first has to do with bank lending. If banks pay higher interest rates to people with savings accounts (short-term rates) than they charge for loans (long-term rates), they may decide to stop giving loans because they’re losing money.
By extension, the lack of loans could mean that consumers and businesses spend less, and that could cause the economy to slow or even slip into a recession.
Another way to think about the relationship between the yield curve and the economy is from the standpoint of an investor. All investments have a risk-return relationship. Every. Single. One.
The higher the risk, the higher the expected return. So, if interest rates (the return) are higher in the short run, that means there is a higher economic risk (i.e. a better chance of a recession) in the short run.
All this once again reminds us that there are no perfect indicators. The yield curve, while historically reliable, missed the mark and predicted recessions that did not occur in both 1966 and 1998.
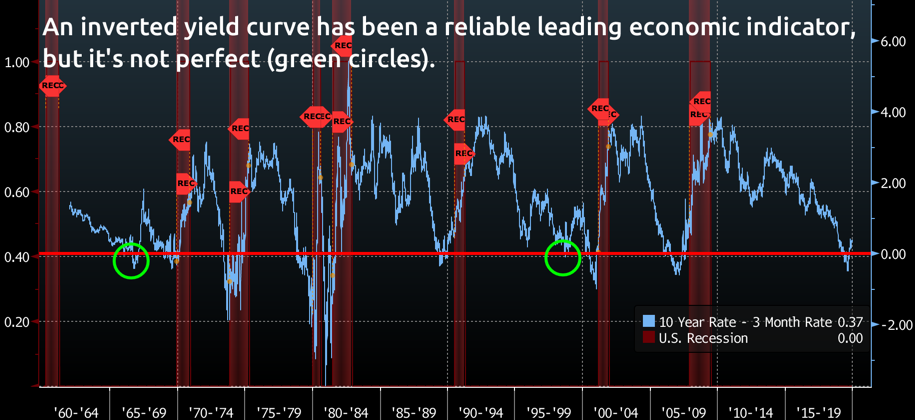
As of mid-January 2020, the yield curve is no longer inverted, but that doesn’t mean we’re out of the woods, just yet. As you can see from the above chart, it was common for recessions to occur after the yield curve un-inverted.
There are, thankfully, a few factors today that could make this indicator less predictable.
One is that, here in the U.S., not only have we experienced an unprecedented period where interest rates hovered around zero, interest rates are actually negative in other parts of the world.
Another consideration is that to encourage economic growth, the Federal Reserve (Fed)—our nation’s central bank—increased its balance sheet to $4.1 trillion during and after the financial crisis by purchasing trillions of dollars in bonds.
For many reasons, the Fed is unable (or unwilling) to shrink its balance sheet back to the pre-financial-crisis level of $900 billion. (It’s quite possible this active bond-buying by the Fed is distorting the yield curve.)
So, accepting that there are no perfect barometers, to gain some insight as to what might lie ahead, instead of relying too heavily on any one factor, we analyze several leading economic indicators.
And, currently, none of the other major leading indicators that we follow are suggesting a recession in the next six to nine months.
Of course, when it comes to the economy, it’s impossible to know what the next decade will bring. After all, almost no one predicted the economic boom of the last ten years.
Unpredictability is just one reason why we put so much time and energy into building and weather-proofing personalized financial plans for our clients.
Because, looking forward to the coming weeks, months and years, whatever happens, we’re here to help you enjoy a prosperous, decades-long retirement – free from worry and the burden of uncertainty.
All data from Bloomberg. The Allworth Recession Index is made up of leading economic indicators, which are data points that have historically moved before the economy. The index value is calculated as a percent of the indicators that are sending signals that suggests recession risk is elevated. When the index value is greater than 40%, we believe there is a greater chance for a recession in the next six to nine months. All data begins by 1971 unless noted below. The indicators that make up the Allworth Recession Index are the 3-Month Government Bond Yield, 2-Year Government Bond Yield (beginning in 1976), 10-year Government Bond Yield, BarCap US Corp HY YTW – 10 Year Spread (beginning in 1987), Conference Board Consumer Confidence, Consumer Price Index, NFIB Small Business Job Openings Hard to Fill (beginning in 1976), Private Housing Authorized by Building Permits by Type, US Federal Funds Effective Rate, US Initial Jobless Claims, US New Privately Owned Housing Units Started by Structure, and US Unemployment Rates.
Past performance does not guarantee future results. Any stock market transaction can result in either profit or loss. Additionally, the commentary should also be viewed in the context of the broad market and general economic conditions prevailing during the periods covered by the provided information. Market and economic conditions could change in the future, producing materially different returns. Investment strategies may be subject to various types of risk of loss including, but not limited to, market risk, credit risk, interest rate risk, inflation risk, currency risk and political risk.
This commentary has been prepared solely for informational purposes, and is not an offer to buy or sell, or a solicitation of an offer to buy or sell, any security or instrument or to participate in any particular trading strategy or an offer of investment advisory services. Investment advisory and management services are offered only pursuant to a written Investment Advisory Agreement, which investors are urged to read and consider carefully in determining whether such agreement is suitable for their individual needs and circumstances.
Allworth Financial and its affiliates and its employees may have positions in and may affect transactions in securities and instruments mentioned in these profiles and reports. Some of the investments discussed or recommended may be unsuitable for certain investors depending on their specific investment objectives and financial position.
Allworth Financial is an SEC-registered investment advisor that provides advisory services for discretionary individually managed accounts. To request a copy of Allworth Financial’s current Form ADV Part 2, please call our Compliance department at 916-482-2196 or via email at compliance@allworthfinancial.com.
January 24, 2020
 January 12, 2024
Fourth Quarter 2023 Market Update
January 12, 2024
Fourth Quarter 2023 Market Update
Allworth's Co-CEO Scott Hanson and Chief Investment Officer Andy Stout team up for this fourth quarter 2023 market update video.
Read Now December 15, 2023
December 2023 Market Update
December 15, 2023
December 2023 Market Update
Chief Investment Officer Andy Stout takes a look back on the year to help give perspective to what's on the horizon in 2024. At the beginning of this …
Read Now November 17, 2023
November 2023 Market Update
November 17, 2023
November 2023 Market Update
Chief Investment Officer Andy Stout examines whether there’s a chance the US dollar will lose its status as the world’s reserve currency. There is a …
Read Now