Allworth Chief Investment Officer Andy Stout takes a deep dive into our views on the economy.
The turning of the calendar empowers people to look forward to putting the negative behind them and focusing on the positive. For me, that means living a healthier lifestyle (or at least attempting to).
Unfortunately, the economy doesn’t have the luxury of using the calendar for a fresh start. So, with that in mind, here are a few things you should be aware of that we continue to watch.
Inflation
Inflation was a problem at the end of last year, and that hasn’t changed. Last month, consumer prices (CPI) hit their highest level in nearly 40 years, climbing 7% on a year-over-year basis. Specifically, car prices and supply-chain bottlenecks were significant factors in December’s inflation print. We expect inflation to continue to get worse for a few more months before easing later this year.
We currently expect inflation to moderate this year because demand from the economic reopening should continue to wane and supply-chain bottlenecks should improve. That doesn’t mean inflation will return to 2% levels, but it does mean we shouldn’t be seeing 7% inflation by the end of the year. The bond market is pricing in CPI at 3.5% for 2022.
However, rising home prices and wages could cause hotter-than-expected inflation this year. But, as of right now, wage inflation (+4.7%) lags CPI (+7%), so workers haven’t been able to demand salary increases that match inflation. If that were to change, that’s when inflation can become stickier because companies could pass on those higher costs to consumers.
The Fed and Rising Interest Rates
Our nation’s central bank, the Federal Reserve (Fed), is responsible for stable inflation and full employment. We could be close to (or even at) full employment, as the unemployment rate sits at 3.9%. However, inflation is not stable.
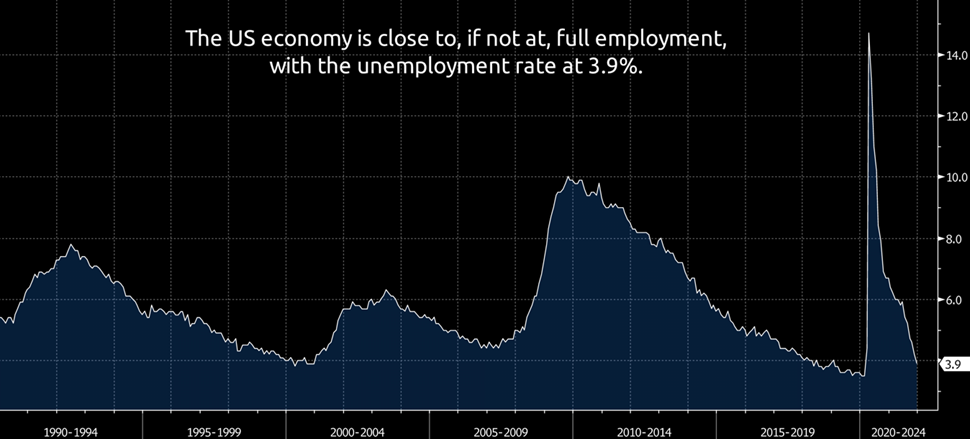
Over the past couple of months, as the economy moved toward full employment, the Fed shifted its focus to fight inflation. Near the end of 2021, the committee suggested it might hike rates three times in 2022, up from one indicated hike just a few months ago.
Since the onset of the pandemic, the Fed has bought trillions in bonds to help keep interest rates low and encourage economic growth. The Fed was on track to stop these purchases in June but decided to speed it up. As a result, these purchases will now stop in March.
Last month, I stated that the Fed might need to do more to curb inflation, and the committee has done just that. Specifically, many members from the Fed are now publicly talking about a March hike, resulting in the bond market now pricing in four quarter-point interest rate hikes this year.
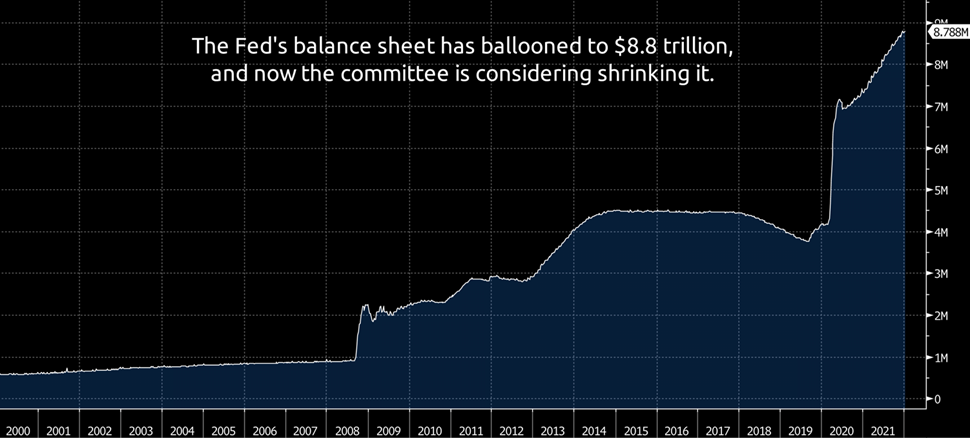
Additionally, the Fed stated it’s looking to reduce the size of its $8.8 trillion balance sheet (this is known as quantitative easing). The last time the Fed went down this path, it took the committee three years to start shrinking its balance sheet after stopping bond purchases. So, the market was surprised when the Fed stated it was looking to shrink its balance sheet shortly after the initial rate hike. Many economists expect this to occur by June.
With that being said, as there is every year, there will be economic curveballs. So, should inflation pressures ease, it wouldn’t be surprising to see the Fed become less aggressive in the second half of the year.
The Fed’s current shift has resulted in both short-term and long-term interest rates rising. In fact, over the past four months, short-term interest rates, which are more sensitive to rate hikes, have increased more than long-term rates. This movement is known as a “bear flattener,” and it has resulted in the yield curve narrowing to 0.79%. This yield curve measurement is the interest rate difference between the 10-year and 2-year Treasury bonds.
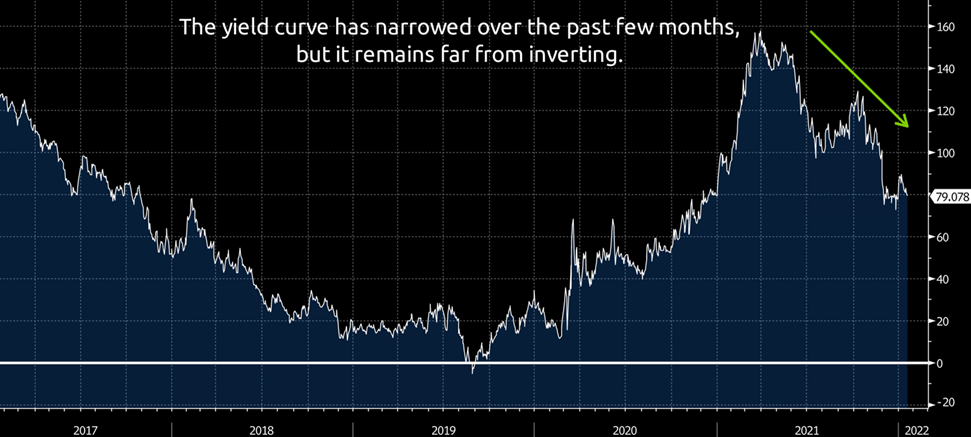
Today’s yield curve is upward sloping and not near an inversion. The yield curve inverts when the 2-year Treasury interest rate is greater than the 10-year Treasury interest rate. However, we will continue monitoring this curve because an inverted yield curve is one of the more accurate leading economic indicators. In other words, a recession often follows a yield curve inversion. It could take six months or two years, but it’s important to note that it has been relatively reliable over the past 50 years.
Volatility
Inflationary pressures and higher interest rates are two primary reasons for this year’s market turbulence so far. But remember, long-term investors should expect volatility. It’s common for stocks to experience 5-15% declines in any given year. Since 1980, the average drop in a calendar year has been 14%. However, the average annual total return for large-cap stocks was +14% during that time, with positive results in 83% of those years.
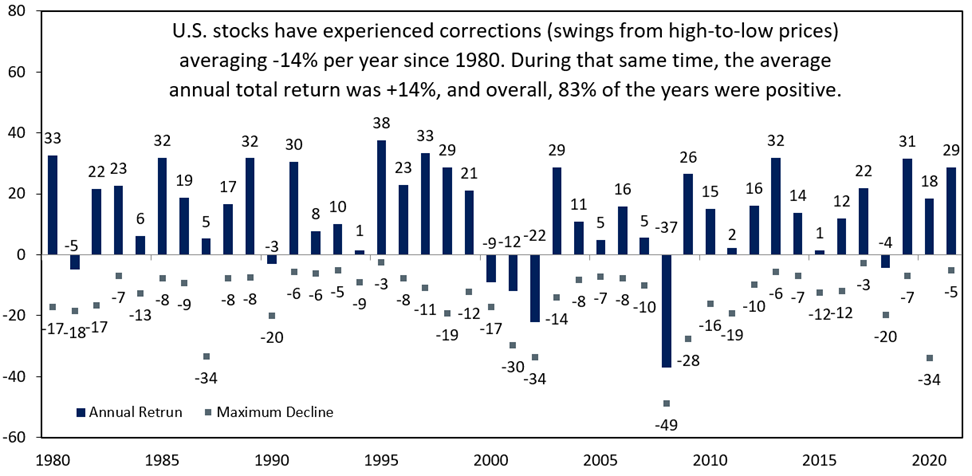
Of course, that doesn’t mean we won’t experience more turbulence, but history shows that, more often than not, remaining patient during selloffs has been a profitable decision.
While the markets are unpredictable in the short run and trend higher over the long run, some factors tend to help determine the market’s path over the intermediate term:
- Earnings
- Theoretically, the value of an asset is based on its future cash flows. So, if a company generates increasing future earnings, that should benefit its future stock price. As a whole, looking at large-cap companies shows that profits have fully recovered from COVID. Therefore, the factor to watch now is forward earnings growth and, more importantly, if earnings grow quicker than expected.
- Wall Street analysts currently expect earnings to increase 8.7% in 2022 (compared to 2021), which is close to average. Since 1990, S&P 500 profits have risen about 8.1% each year. Profit growth will likely eclipse 8.7%, as about 75-80% of companies usually report better-than-expected earnings.
- Economic Growth
- As there always is, there is uncertainty surrounding earnings. For example, we’ll be watching to see how inflation potentially squeezes profits, and, of course, COVID could also be an issue. Another important factor is economic growth. Part of the reason for this is that when the economy grows, earnings grow. But when the economy shrinks, profits also fall.
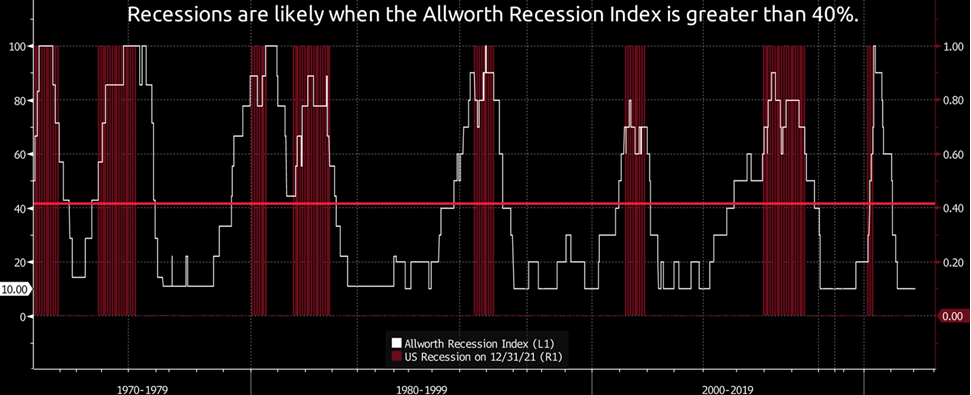
- We continue to closely monitor our proprietary Allworth Recession Index, which currently suggests low recession risk. Typically, leading economic indicators give an advanced warning of a slowdown by about six-to-nine months. However, this recovery is far different from others, so a nuanced approach is required. Accordingly, we have shortened this look-forward to approximately three months.
Everything Else
The above are some of the more significant things we monitor. But we also stay on top of countless other forces, such as tax and spending policy, geopolitics (e.g., Russia/Ukraine), COVID-19 economic effects, worldwide economic growth, other central banks’ monetary policy, valuations, and cryptocurrencies, to name just a few.
It’s critical to understand how these factors affect the economy and interact with your investments. The appropriate allocation of your investments goes a long way toward helping to make certain that you can fully enjoy your retirement.
January 21, 2022
All data unless otherwise noted is from Bloomberg. Past performance does not guarantee future results. Any stock market transaction can result in either profit or loss. Additionally, the commentary should also be viewed in the context of the broad market and general economic conditions prevailing during the periods covered by the provided information. Market and economic conditions could change in the future, producing materially different returns. Investment strategies may be subject to various types of risk of loss including, but not limited to, market risk, credit risk, interest rate risk, inflation risk, currency risk and political risk.
This commentary has been prepared solely for informational purposes, and is not an offer to buy or sell, or a solicitation of an offer to buy or sell, any security or instrument or to participate in any particular trading strategy or an offer of investment advisory services. Investment advisory and management services are offered only pursuant to a written Investment Advisory Agreement, which investors are urged to read and consider carefully in determining whether such agreement is suitable for their individual needs and circumstances.
Allworth Financial and its affiliates and its employees may have positions in and may affect transactions in securities and instruments mentioned in these profiles and reports. Some of the investments discussed or recommended may be unsuitable for certain investors depending on their specific investment objectives and financial position.
Allworth Financial is an SEC-registered investment advisor that provides advisory services for discretionary individually managed accounts. To request a copy of Allworth Financial’s current Form ADV Part 2, please call our Compliance department at 916-482-2196 or via email at compliance@allworthfinancial.com.
Give yourself an advantage. Sign up to receive monthly insights from our Chief Investment Officer, and be the first to know about upcoming educational webinars. You'll also get instant access to our retirement planning checklist.
 January 12, 2024
Fourth Quarter 2023 Market Update
Allworth's Co-CEO Scott Hanson and Chief Investment Officer Andy Stout team up for this fourth quarter 2023 market update video.
Read Now December 15, 2023
December 2023 Market Update
Chief Investment Officer Andy Stout takes a look back on the year to help give perspective to what's on the horizon in 2024. At the beginning of this …
Read Now November 17, 2023
November 2023 Market Update
Chief Investment Officer Andy Stout examines whether there’s a chance the US dollar will lose its status as the world’s reserve currency. There is a …
Read Now
