
May 22, 2020
Allworth Chief Investment Officer Andy Stout answers four pressing questions about the economy and markets during today’s highly uncertain times.
Like many of you, I’ve been constrained at home. The cause of this self-quarantine has led to numerous interesting questions about our uncertain financial world.
For this month’s Market Update, I’ve collected some of the more urgent inquiries and figuratively put pen to paper to provide answers.
1. When will the economy recover from the coronavirus pandemic?
It’s no surprise that the sudden economic stop prompted by the coronavirus is causing economic damage at never-before-imagined levels. Economists are *currently* expecting the economy to shrink in the second quarter (April, May, and June) by an astounding 40% (on an annualized basis).
That means our nation’s output could drop from $21.5 trillion to about $19.6 trillion by the end of June.
The trajectory of the economy in the months beyond the second quarter will be heavily dependent on the medical progress in the fight against the virus. The quicker there is progress, the faster people will feel comfortable venturing out into crowded areas, such as ballparks, movie theatres, and retail stores.
Our baseline economic scenario is a substantial decline in the economy in the second quarter, but that could be followed by economic growth around 10% in the second half of the year. (Growth will only likely be that high because we will be coming off such a low base.) Growth will likely then moderate, but stay positive, as we will be reluctant to return to the lifestyle many of us enjoyed before the pandemic. Then, once the coronavirus is well behind us (because of a vaccine, herd immunity, or an extremely effective therapeutic), economic growth will probably return to normal levels.
This means that the size of our economy probably won’t return to December 2019 levels ($21.7 trillion) until sometime in 2022. (Obviously, the clear risk here is that, as local economies open back up, the coronavirus curve could steepen, and our economy could be forced to close back down.)
Even in this baseline scenario, without a second coronavirus wave, with 20-30 million people having lost their jobs, there are still numerous risks. It’s a commonly held perception that people who have lost their job will be able to easily find a new one once the virus is behind us. However, if there are too many bankruptcies, this could result in structurally high unemployment.
2. Why have stocks not struggled like they did in 2008?
To be fair, we aren’t out of the woods yet, which is why having a diversified portfolio is so important. What’s helped to stabilize stocks is the massive stimulus from Congress and the Federal Reserve. So far (and yes, more is likely), Congress has approved about $2.9 trillion in fiscal stimulus. This includes billions for individuals, businesses, and state and local governments.
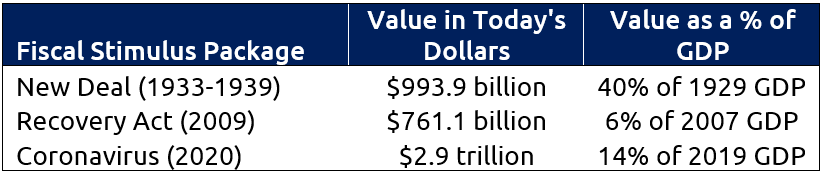
To put that $2.9 trillion into perspective, let’s compare it to the two other times fiscal stimulus was used on a grand scale – the Great Depression (via the New Deal) and the Great Recession (via the Recovery Act). New Deal spending at the time was about $41.7 billion, and Recovery Act spending was $840 billion.
To make these numbers comparable, an inflation adjustment is necessary. In today’s dollars, the $2.9 trillion of coronavirus spending is much larger than either of the other two periods.
One positive is that economic productivity has greatly improved over the past hundred years, so it makes sense to also look at these numbers as a percent of GDP. While the coronavirus spending is smaller (as a percent of GDP) than the New Deal, the amount of spending is still quite significant.

In addition to the fiscal stimulus from Congress, the level of monetary stimulus from the Federal Reserve is unprecedented. The nation’s central bank quickly cut short-term interest rates to zero, began buying an unlimited amount of bonds, initiated a lending program to small- and mid-sized businesses, and much more.
The Federal Reserve’s balance sheet ballooned from $4.2 trillion to $6.9 trillion in just three months. They began buying all sorts of bonds to provide liquidity to the bond market, and this also improved access to capital for companies in need.
This monetary and fiscal stimulus has been crucial for market stability. However, there’s no guarantee that the future will be a smooth ride. One of many things we are watching is stock valuations. They are elevated when comparing current prices to expected earnings over the next 12 months, as the S&P 500 is trading at 20 times forward earnings. The market is ignoring this and is instead focusing on an earnings recovery beginning sometime in 2021. Should the economy get off track and those future earnings not be attainable, there is risk for further market turbulence.
3. With the government flooding the economy with trillions of dollars, how likely is inflation?
With the coronavirus constraining demand, the inflation risk is low. This is because people are not spending at normal levels, which is keeping the prices of goods and services in check. Once the coronavirus is no longer a concern, however, the inflation outlook gets murky.
Back in school, our economics professors taught us that inflation occurs when the equilibrium between supply and demand is out of balance. Not only are there many things that can lead to this imbalance, they are also all related to one another:
- High deficits
- Money supply greater than aggregate output
- Increasing demand
- Elevated input costs
- Weakening currency
We can easily see that some of these factors could be a concern once we are no longer worried about COVID-19. For example, Congress has already spent $2.9 trillion in fiscal stimulus. This will, of course, increase our deficit, especially as tax revenue will be lower.
This deficit, along with the extraordinary actions taken by the Federal Reserve, will increase the money supply. Anecdotally, one could argue there has never been a period in our history when pent-up demand was so high. People just want to get out of their house, and when they do, they will spend (assuming they have the means to do it). The rising money supply and pent up demand could result in too many dollars chasing too few goods, which is the very definition of “demand-pull” inflation.
The rising cost of making a product can also lead to inflation. This is known as “cost-push” inflation. With global supply chains broken, including some factories going bankrupt, the cost to “source” product inputs could rise. Further, nationalistic sentiment could lead some companies to bring factories back to their home country. This relocation also allows companies to better control the supply chain in the event of global shocks, such as pandemics and wars (including cold wars).
Bringing these factories home will come at a cost, however, and that includes a higher cost of goods sold.
So, there is a solid academic argument for inflation later in 2021, but there are a few other things that could mitigate that. If bankruptcies soar much more from here, the 20-30 million people currently out of work might have a tough time finding a job if there are no companies to employ them. (This means that the demand for goods and services could be subdued.)
There is also the possibility that, to pay for these deficits, the government will raise taxes. This would constrain spending and keep a lid on inflation. Moreover, the fact that the average age of most Americans (and most of the developed world) continues to rise, could also restrain inflation.
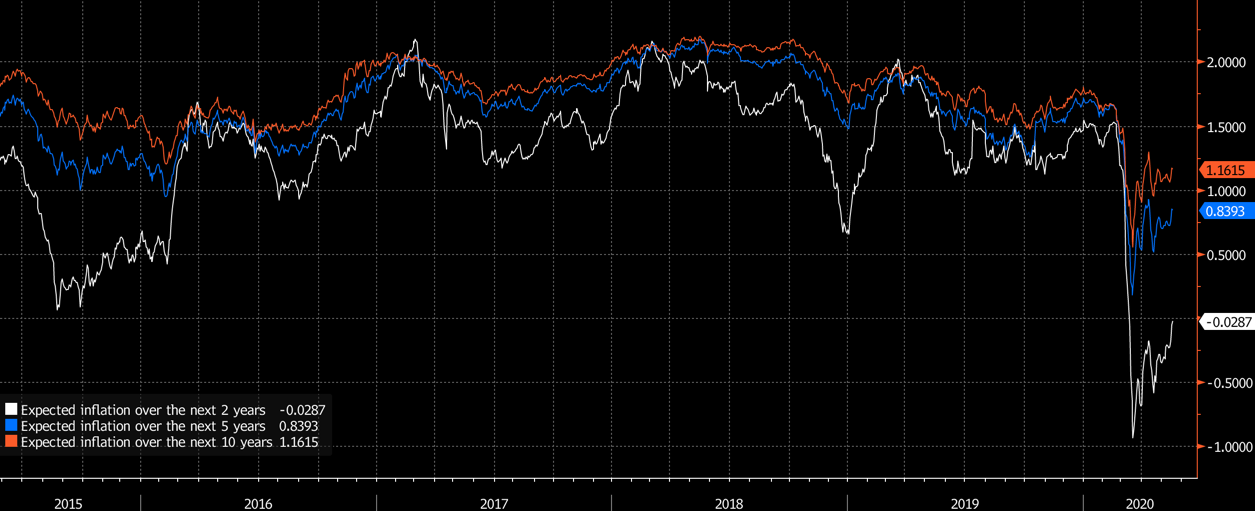
Another important consideration is that the bond market is NOT expecting inflation. We can see this by studying the difference between yields on traditional Treasury bonds and TIPS (TIPS are Treasury bonds whose value changes with inflation). Comparing the yields on these bonds shows us how much inflation the market is pricing in.
Expected inflation crashed as the reality of the pandemic set in. While expectations have improved over the past few weeks, they remain low by historical standards. Deflation is expected over the next two years. Over the next five years, the bond market expects just 0.8% inflation per year. The expected inflation each year over the next 10 years is 1.2%. To put this into perspective, the period of hyperinflation during the early 1980s peaked at 14.8%.
Looking at all the data together leads us to believe that the concerns of uncomfortably high inflation are overblown. With that said, higher inflation than we’ve seen over the past 10 years is probably on the horizon once the coronavirus is behind us. (The average inflation during the 2010s was 1.8%, and the highest inflation print during this time was 3.9%.)
4. With interest rates so low, why should I own bonds?
Bonds are much more than merely income-generating securities. That’s because bonds:
- Generate income (sometimes tax-free)
- Offer protection when stocks move lower
- Provide liquidity when you need your money
- Gain in value when interest rates drop
- Give you the opportunity to reinvest at higher rates when rates rise
And while bonds often have similar income distributions as CDs, bonds have a few distinct advantages. One advantage is liquidity. If you need your money for any reason, those bonds (or bond funds) can be sold without a penalty. However, if you want to cash out your CD, it’s common for a penalty to be assessed. Said another way, you’ll get less of your own money back at a time when you need it most.
Another advantage of bonds is that when stocks experience sharp selloffs, it’s common for bonds to increase in value. If you have a diversified portfolio, then bonds act as a shock absorber to offset some of that stock market decline. Conversely, CDs will not enjoy any increase in value.
Owning all stocks and zero bonds might work out well over the long run, but that’s only true if you stay the course. Many investors are understandably unable to stomach the volatility of a portfolio comprised of 100% stocks. Bonds will keep you invested, so you can meet your retirement goals.
The income a bond generates is dependent on the interest rate environment. Today, bonds are paying out less income than the past few years. And, it’s possible rates will fall farther. If they do, then your bonds will likely increase in value. If rates increase, bonds could temporarily decrease in value, but that also means you will be able to invest in bonds that are paying out more income, and that should, in time, offset any price change.
Conversely, you might not be able to reinvest at higher interest rates with CDs, depending on how long you are locked in.
Perhaps bonds are best described as a critical investment that can help you enjoy your retirement while taking on an acceptable level of risk.
All data from Bloomberg. The Allworth Recession Index is made up of leading economic indicators, which are data points that have historically moved before the economy. The index value is calculated as a percent of the indicators that are sending signals that suggests recession risk is elevated. When the index value is greater than 40%, we believe there is a greater chance for a recession in the next six to nine months. All data begins by 1971 unless noted below. The indicators that make up the Allworth Recession Index are the 3-Month Government Bond Yield, 2-Year Government Bond Yield (beginning in 1976), 10-year Government Bond Yield, BarCap US Corp HY YTW – 10 Year Spread (beginning in 1987), Conference Board Consumer Confidence, Consumer Price Index, NFIB Small Business Job Openings Hard to Fill (beginning in 1976), Private Housing Authorized by Building Permits by Type, US Federal Funds Effective Rate, US Initial Jobless Claims, US New Privately Owned Housing Units Started by Structure, and US Unemployment Rates.
Past performance does not guarantee future results. Any stock market transaction can result in either profit or loss. Additionally, the commentary should also be viewed in the context of the broad market and general economic conditions prevailing during the periods covered by the provided information. Market and economic conditions could change in the future, producing materially different returns. Investment strategies may be subject to various types of risk of loss including, but not limited to, market risk, credit risk, interest rate risk, inflation risk, currency risk and political risk.
This commentary has been prepared solely for informational purposes, and is not an offer to buy or sell, or a solicitation of an offer to buy or sell, any security or instrument or to participate in any particular trading strategy or an offer of investment advisory services. Investment advisory and management services are offered only pursuant to a written Investment Advisory Agreement, which investors are urged to read and consider carefully in determining whether such agreement is suitable for their individual needs and circumstances.
Allworth Financial and its affiliates and its employees may have positions in and may affect transactions in securities and instruments mentioned in these profiles and reports. Some of the investments discussed or recommended may be unsuitable for certain investors depending on their specific investment objectives and financial position.
Allworth Financial is an SEC-registered investment advisor that provides advisory services for discretionary individually managed accounts. To request a copy of Allworth Financial’s current Form ADV Part 2, please call our Compliance department at 916-482-2196 or via email at compliance@allworthfinancial.com.
May 22, 2020